| Financial bubble - who will say that the emperor is naked? | The Oil Drum: Europe | Implications of "Peak Oil" for Atmospheric CO2 and Climate |
Oilwatch Monthly - May 2007
Posted by Rembrandt on May 21, 2007 - 4:38am in The Oil Drum: Europe
To aid and inform interested people and especially analysts worldwide I have decided to start a monthly newsletter which tracks oil production and stock levels called oilwatch monthly. Many people have no clue about which countries have already peaked or which countries are still on the upslope. I frequently meet people working in the energy discipline in the Netherlands who for instance do not know that production in the North Sea has been declining rapidly since 2000. This newsletter will cover as a basis monthly and quarterly data from the latest freely available Oil Market Report of the International Energy Agency, the Short Term Energy Outlook of the Energy Information Administration, and in future versions the Oil, Gas, Coal & Electricity - Quarterly Statistics of the International Energy Agency, in which a clear division between conventional, natural gas liquids and unconventional oil production is published. In the next edition I intend to add a better division between (conventional) crude oil and all liquids where possible.
For now, enjoy the first issue with 14 pages of graphs of production levels sorted out per region, the aggregrate production of the world and stock levels in Europe and the United States: (PDF size 3.5 megabyte). Feel free to use this newsletter in writing and communication as long as you cite me (Rembrandt Koppelaar), TOD, and ASPO Netherlands.
[Ed. note by Super G] The comment timestamps in this post are incorrect. I hope to restore them soon.
A selection of charts of this issue:
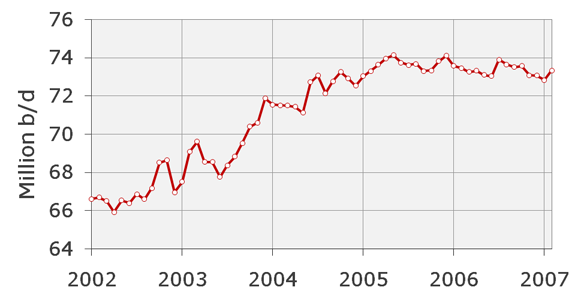
Chart 1: World Production of Crude Oil, source: EIA
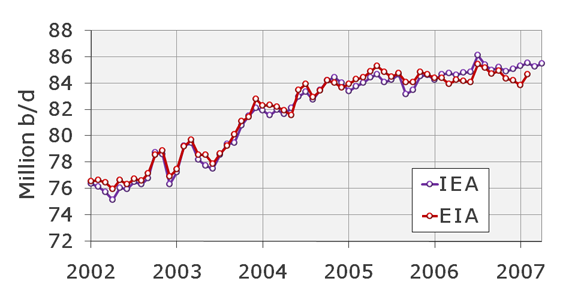
Chart 2: World Liquids production, source: EIA & IEA
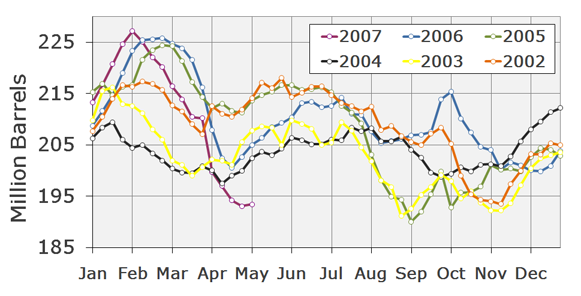
Chart 3: U.S. Gasoline Stock Levels, source: EIA
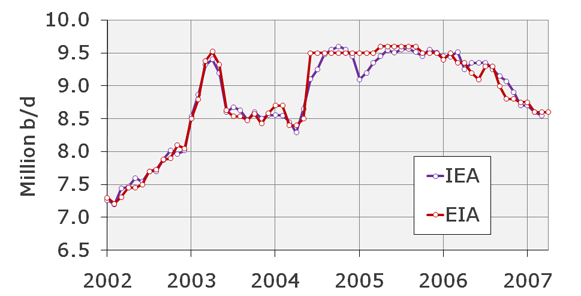
Chart 4: Saudi Arabia Crude Oil Production including half of the Neutral Zone, source: EIA & IEA*
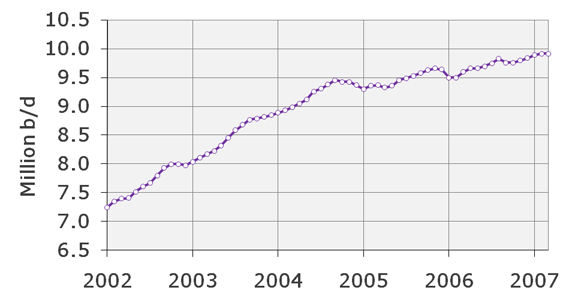
Chart 5: Russia Liquids Production, source: IEA
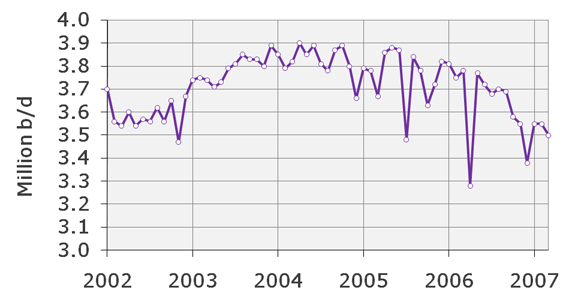
Chart 6: Mexico Liquids Production, source: IEA
Personnel
Editors
Contributors
Peak Oil Primers
Archives
- November 2010 (3)
- October 2010 (6)
- September 2010 (4)
- August 2010 (7)
- July 2010 (6)
- June 2010 (7)
- May 2010 (2)
- April 2010 (8)
- March 2010 (4)
- February 2010 (6)
- January 2010 (3)
- December 2009 (5)
- November 2009 (8)
- October 2009 (12)
- September 2009 (6)
- August 2009 (5)
- July 2009 (11)
- June 2009 (8)
- May 2009 (16)
- April 2009 (10)
- March 2009 (7)
- February 2009 (10)
- January 2009 (15)
- December 2008 (9)
- November 2008 (9)
- October 2008 (9)
- September 2008 (13)
- August 2008 (10)
- July 2008 (14)
- June 2008 (23)
- May 2008 (16)
- April 2008 (12)
- March 2008 (16)
- February 2008 (9)
- January 2008 (13)
- December 2007 (13)
- November 2007 (16)
- October 2007 (22)
- September 2007 (8)
- August 2007 (9)
- July 2007 (16)
- June 2007 (8)
- May 2007 (7)
- April 2007 (7)
- March 2007 (10)
- February 2007 (10)
- January 2007 (12)
- December 2006 (9)
- November 2006 (15)
- October 2006 (4)
- September 2006 (5)
- August 2006 (5)
- July 2006 (9)
- June 2006 (5)
- May 2006 (10)
- April 2006 (9)
- March 2006 (13)
Vital Trivia
License

This work is licensed under a Creative Commons Attribution-Share Alike 3.0 United States License.
Rembrandt,
Three cheers! I love the idea, great addition, but can I hit you right out of the gate with a request?
Please consider adding any information you can find on LPG (Liquified Petroleum Gas) or propane.
I have been at a complete loss in a 10 month effort in my attempts to find useful and valid price, supply and production information on propane.
It is like a "closed" industry. There are few attepts to market futures in propane, almost no attempts to market data on production and storage, and little information on the international propane trade. I have found a handful of greatly outdated newsletters, usually promotional stuff put out by the propane gas industry, "it's the fuel of the future, there's plenty, it's clean and cheap, the future is big, yada, yada...."
Please consider assisting in providing info in an area that has been virtually ignored....
Thanks, Roger Conner Jr.
Remember, we are only one cubic mile from freedom
Hello Rembrandt,
Cool idea! I will be sure to reference your name, ASPO, and TOD if I use any charts and/or quotes. Is this following example minimally sufficient?
source: TOD & ASPO/NL member Rembrandt Koppelaar
Or would you prefer some other way to clearly document the ownership source?
I have no idea how much work would be involved in offering this info in various different languages--a suggestion for a later timeframe?
Bob Shaw in Phx,Az Are Humans Smarter than Yeast?
Is it possible to also have a "world crude oil export" chart? This would be very interesting.
Marco.
ecco :))
Dear Rembrandt. Thanks for your effort and for a useful document that put things in perspective.
I have naturally also a wish :-)
Is it possible to aggregate the North sea figures into one "north sea" diagram ?
Thanks again /And1
And1 - UK and Norwegian production data includes many fields from the Atlantic margin and in the case of Norway, also the Barents Sea. So it depends if you want NW Europe or specifically the North Sea.
Dear EM, I got your point. Let me rephrase.
"Oil production from NW Europe". It will be useful for discussions with peak oil illiterates to show that the whole NW region of Europe as such is in decline.
Kind regards/And1
This is really useful, Rembrandt. Many thanks for your work.
Just a few minor suggestions:
1) It looks like there's room on page 3 for US distillate stocks. I know gasoline is all in the news at present, but if we ever have a bad winter...
2) I'm sure this is something that you would want to be seen by policymakers and industry analysts, and therefore I feel it's important that it should be as professional as possible. I know this will seem like a picky, minor gripe, but I notice in the opening write-up that you are interchangeably using both upper- and lower-case letters at the start of month names (february and February). I believe they should all be upper-case. You also have "juli 2006" in para 1, and "July 2006" in para 3.
A more arguable point is the use of a period to delineate thousands rather than a comma (226.000 vs 226,000). To be consistent with data releases in English from other main sources I think a comma should be used.
3) I looked on the ASPO Netherlands site and I can't see a page dedicated to downloads. You've given an advance release date for the next issue (very useful, thanks) but there's no way to hyperlink to a place where it can be accessed from. I think you should have such a page, and in English too since this is the language of the publication. (If you click on my usename above you will see that I've added Oilwatch to my calendar of releases for June in my bio. The link is to your home page, but a direct link to a download page would be better).
Thanks again - I look forward to future issues.
Thanks for your comments, and questions. A response in series:
1) ThatsItImout
Information on Liquified Petroleum Gas is indeed very difficult to find and probably not existent in the category free to cheap sources of information. I don't have any source to such information at the moment so can't add it to the newsletter. Have you tried contacting Jean Laherrere?
2) To totoneila or Bob Shaw
Referencing like that is fine :), different languages would be too time consuming at the moment, maybe later when ASPO-NL is going at full speed (we just opened an office and have 2 people working part time).
3) Marco
A crude oil export graph is possible to a certain extent, there is good historical data on imports in OECD countries and little data on imports in non-OECD countries. I would like to do this but compiling the data will take time (at least a day or two). So I will put it on my list for the July newsletter.
4) And1
No problemo, will add charts per region in the next edition
5) FTX
a. Distillate stocks will be added
b. Your points about the professionalism are well taken and not at all picky, I need to find someone who will proofread everything just before it comes out.
c. Page dedicated to downloads will be added for next issue in English with monthly archives
First of all, very nice work. I will be an avid reader.
Second, and in the spirit of proofreading, a little detail: in the charts with several yearly records, for example in the "Chart 3: U.S. Gasoline Stock Levels, source: EIA" reproduced above, the oldest record (in the example, the one for 2002) comes out on top. It would make more sense if the newest one was on top, I guess.
Rembrandt,
Please see my other response with my praise for this new publication. But I wanted to add this here as another potential improvement -
Please could there be a graph of oil production by "OPEC subject to quota" countries - ie with Iraq and Angola excluded. This is for the reason that although they are members of OPEC they are not included in its quota system. The graph should also include the official OPEC quota output. This way we can see how OPEC are performing relative to quota. This is very important, because one of the (to my mind) most worrying facts about the KSA decline was that it happened FIRST, and THEN the quota was reduced. By looking at OPECs performance we'll get to see whether the current plateau we're on is due to 1) above ground factors (can be overcome) or 2) geological factors (very worrying)
By the way, one of the things that your excellent publication actually makes very clear is that there are comfortable stocks of crude oil in the world relative to historical stock trends. On the basis of stocks alone (forgetting for the moment, declining production) one would be SHORT oil!
Regards,
Cuchulainn
Rembrandt - this is great work and extremely useful. I'll use this all the time. You maybe want to stick an author reference on every chart - light grey water mark. I for one will cut and use these charts on a regular basis.
A couple of observations. Despite Buzzard coming on at near capacity, the trend of falling peaks and troughs in the UK has not been broken. We have had a lot of focus recently on Saudi Arabia and I'm beginning to wonder what is the state of the fields in UAE - they just had a couple of super giants from what I can recall - Bab and Zacum? Azerbaijan - pumping 800,000 bpd up from 300,000. The BTC pipleine has capacity of 1 million bpd - so it looks like this is not yet at capacity - some more supply growth to come there.
Is it possible to identify top ten NGL producers?
Its a lot of work to produce this monthly - so I wonder if quarterly may suffice - but showing monthly data.
Regarding UAE, around 200,000 b/d of additions from 2006 to 2007 and 300,000 from 2007 to 2008, coming from NEB Phase I (al-Dabb-iya, Shanayel, Rumaitha), Bu Hasa, Lower Zakum - Umm Shaif, OGD 3 & AGD 3 and Huwaila.
So far these increases in the UAE do not have any effect, production has been flat since the end of 2005. In this case I would say they voluntarily dropped production to drive oil prices higher.
>Is it possible to identify top ten NGL producers?
Yes, but not on a monthly basis since the monthly data per country is very bad. There is good quarterly data available in the IEA's quarterly OECD statistics bulletin. This however also includes lease condensates and maybe even some synthetic liquids (canada) from what I can spot in the numbers.
Top producers (4rd quarter 2006) for NGL are as follows according to the IEA:
USA - 1,759,000 b/d
Saudi Arabia 1,510,000 b/d
Algeria 810,000 b/d
Canada 699,000 b/d
United Arabic Emirates 579,000 b/d
Norway 547,000 b/d
Qatar 410,000 b/d
Mexico 400,000 b/d
Iran 391,000 b/d
Russia 316,000 b/d
>Its a lot of work to produce this monthly - so I wonder if quarterly may suffice - but showing monthly data.
Ill keep it on a monthly basis for now, most work goes in the changes throughout the entire database, or adding new parts such as import-export data.
Excellent idea and work.
I will look forward to this monthly addition.
Thanks for your efforts, Rembrandt. Very useful.
Capital stuff Rembrandt. Thanks for your work; the energy world is richer with it.
Interesting… all Middle East producers seem to be in decline or dormant. Especially Iran, looking at the EIA numbers, seems to be on the down slope.
Thank you, Rembrandt! This is immensely useful. May I second the suggestion from Euan of a watermark on the graphs?
Ghawar Is Dying
The greatest shortcoming of the human race is our inability to understand the exponential function. - Dr. Albert Bartlett
Great idea and great work.
Please consider adding at least one graph of global production that starts at a date earlier than 2002. Such a graph would give greater perspective of more recent trends over the last 5 years.
Im actually working on how I can create charts that show historical production in each of them in an easily viewable manner next to the 5 year range.
Thanks, Rembrandt. Again, important and great work!
Here's something I had in mind. Decided not to wait.
LNG Supply Projections
Wood Mackenzie published a forecast of LNG world supply.
On page 17 of this Southern Gas PDF there is a chart showing the Wood Mackenzie forecasted LNG supply growth curve:
http://www.southerngas.org/EVENTS/documents/NorthAmGasMarketOutlook-Wood...
Excellent work. I look forward to the next installment. I'm curious, I can't tell from the graph. What is the IEA reporting Saudi and Neutral Zone production as for February, March, and April?
Rembrandt,
Thnak you for your excellent work. This is yet another piece which is concise and informative, as is so many of the great articles puclished and maintained on the Oil Drum.
This may be slightly of topic, but along with the many other requests I had an Idea for a chart which I think would be very useful. I wish that I had the time and talent to construct this chart, but I lack both.
There has been a number of variations of charts showing Crude, liquids, crude & condensate, oil and gas in Barrel equivalent, etc. It seems to me that each liquid including crudes of different weights have varying Energy content. There appears to be an increase in the percent of heavy vs light etc. Would it be possible to normalize all of these and track something such as a Net BTU or Net Energy Production? If that were possible, I believe the point of Peak would become more relevant.
Respectfully,
EJ
Rembrandt,
Fantastic work. I will be a regular reader of this - it pulls together alot of data which forms the basis of the stuff we're all trying to figure out. Thank you very much for taking on this undertaking and I hope you will persist with it - it will add an awful lot.
And, if you're not already an oil market analyst, this will probably end up getting you a job as one!!
Regards,
Cuchulainn
This is excellent and most appreciated.
I'm a member of a town alternative energy commission that is initiating a wind energy project proposal, and this sort of information is precisely what I've needed to impress upon the town leadership why it is crucial to support such a project.
The aggregate graphing makes explaining things a whole lot easier.
Another set of graphs I'd like to see are demand and/or import growth/decline ones of various key countries or regions. Production is but one half of the picture, whereas where it is and is not going lately is worth understanding too.
Thanks so much.
Anybody else having trouble. When I clink on the link to the graphs [PDF size 3.5 megabyte] nothing comes up.
As oil prices rise we will start to get more rationing by price, so it is useful to look at the demand side. Here are some (outdated) country figures taken from Nationmaster for some oil importers.
Notes:
The GDP and industrial output figures give two simplistic ways of measuring how well importing countries will be able to pay for more expensive oil. Imports/GDP gives a measure of the relative burden of expensive oil on the economy, and imports/industry is related to efficiency of use. Ranking by imports/GDP gives:
and the most vulnerable by imports/industry are:
This crude approach doesn't take account of how dependent critical infrastructure is on imported oil, eg hospital generators in Bangladesh. With that caveat, countries nearer the top of the lists are likely to see larger effects on their economies earlier - eg China looks less vulnerable than the US.
From the UK perspective, we will still be a long way from being priced out of the market even when we are importing 50% of our oil, but a lot depends on how rapidly our oil production declines and how quickly we can convert to non-fossil-fuel energy sources. UK@100% would still leave us in a (slightly) better position than France and Germany, based on these figures.