Water in the Gas Tank
Posted by Stuart Staniford on March 26, 2007 - 10:24am
Further Forensics on Saudi Oil Supply

Background
I have been arguing recently that, since about the middle of 2004, Saudi Arabian oil production has been supply constrained, and that in particular the production declines since the middle of 2005 are not voluntary. See Saudi Arabian Oil Declines 8% in 2006 and A Nosedive Toward the Desert. Also see, for a contrasting view, Euan Mearn's posts Saudi Arabia and that $1000 Bet, and Saudi Production Laid Bare. Behind the scenes, Euan and I have exchanged a lot of email trying to figure out the points of agreement between us, as well as the remaining areas of disagreement.I see that Cambridge Energy Research Associates continues to have a radically different view of future (2015) oil supply:
Saudi Arabia was ranked No. 1. Its output was forecast by Cambridge to grow to 14.3 million barrels per day from 2005 output of 12.7 million bpd.I suppose if one thinks they produced 12.7mbpd in 2005, then one is in fantasy land about the past, never mind the future.
I'd like to start out this analysis by creating a lettering system for regions of interest in the Saudi production curve. The hope is to give us a common terminology for what we are referring to. I have lettered each separate feature (as I see it - we could always subdivide later if needed), so that we can debate what is going on at each phase. Here's my scheme, superimposed on a graph that shows Saudi production at the bottom, oil rig count in the middle, and sales weighted price of OPEC exports at the top:
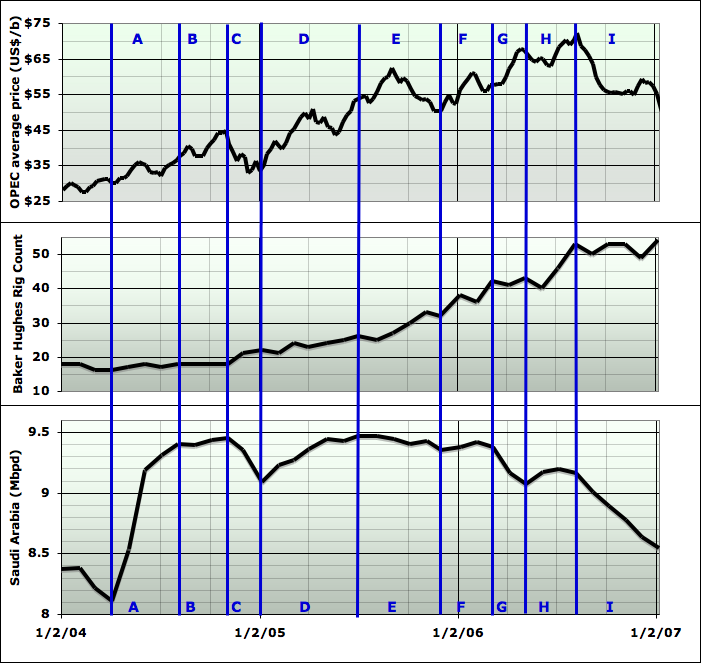
I am focussing now on the period since the beginning of 2004, since there is no controversy about what was happening prior to that. Everyone agrees that, before the second quarter of 2004, Saudi Arabia had at least some spare capacity and was acting as the swing producer. The regions I have labelled, and a brief description of discussion so far are as follows.
- A:
- This is the rapid rise in Saudi production from April 2004 to August 2004. I have suggested, based on analyzing the extensive discussion in OPEC Monthly Oil Market Reports, that this was a deliberate effort to moderate prices in the face of increasing demand and prices rising far above the agreed OPEC price band at the time. I'm not aware of any serious dissent on this explanation. Saudi Arabia has increased production to accomodate rising demand many times in the past, so this behavior was "in character".
- B:
- From August 2004 to November 2004, Saudi production goes flat despite the fact that prices have not been brought under control and are still rising. My interpretation is that this level of production was the maximum possible at the time. Others seem to believe that in general perhaps the Saudis changed their approach and decided higher prices were fine and they'd prefer to make more money by voluntarily reining in production. I'm not sure if anyone thinks this decision was taken as early as August 2004, but I think to explain the data in B as voluntary holding back, one would have to make that assumption (which is fairly problematic since the Saudis would have no basis for changing their view of the effect of these prices on the world economy yet). I believe Euan may agree with me that this is likely the maximum plateau production at the time. It's also potentially significant that the rise in rig counts begins at the end of this period B. Given the lead time to get a rig to Saudi Arabia, it's likely that the decision to start building up the rig fleet was taken sometime during period B (or possibly earlier).
- C:
- From November 2004 to January 2005, there is a sudden and fairly sharp decline in production by about 350kbd. This coincides with a sharp price break down from $45 to $35 (in this series which is generally a little lower the the oft quoted NYMEX front month, or West Texas Intermediate spot price) I think at this point Euan and I are in relatively close agreement that this is probably something along the lines of "Phew, prices are dropping, let's rest some of our more tired/problematic wells."
- D:
- From January 2005 to July 2005, there is a gradual and slowing rise in production that roughly restores the November 2004 level. This occurs as prices are rising from $35 to $55. A mystery is why some of the 690kbd of additional production capacity from the Qatif megaproject does not allow for higher production during this period. I lean to the explanation that something else declined, but specific attribution is not possible at present (see discussion below). People who believe in voluntary restraint could argue that the Saudi's had by now decided the world could cope with $45 oil and wanted to see what $55 oil would do. However, the specific pattern of production rise seems very problematic for this explanation. As prices rise from $35, the Saudis increase production at the fastest rate we have seen since (suggesting an attempt to respond to demand and moderate prices), but then as prices continue to rise, they respond less and less. Why increase production at all if they just wanted prices to go up? And given that they decided to increase production, what are the implications of the gradual creep up, from a country that in the past could jump production by 1-2mbpd in a month or two? Rig count rises slowly but steadily through this period. (As an aside, the Oil Drum is founded in March during this interval as people everywhere start to wonder what is going on with oil markets. Twilight in the Desert is published in June).
- E:
- From July 2005 to Dec 2005, production is flat and then begins gently declining (continuing the deceleration trend of period D). This starts to occur in the face of sharp price increases to the 2005 peak of around $62 in September, and there is no noticeable break in the trend line as prices then fall back to to around $50 by December. I will argue below that the likeliest hypothesis for this decline is the beginning of the cresting of the flood front in North Ghawar. I am unclear how the voluntary restraint hypothesis can explain both the decision to push prices up to $62 by dropping production, and then allowing it to fall to $50 by not dropping production faster as price falls. Rig counts rise more rapidly through this period.
- F:
- There is a very slight production hike from Dec 2005 to February 2006. I now have ascertained that the Qatif redevelopment megaproject was not actually completed in all respects until December 2005. So it is possible that this represents a boost from some last portion of the Qatif redevelopment. Rig counts continue to rise.
- G:
- Production resumes declining , more rapidly now, from Feb to May 2006. This is occurring in the face of prices increasing sharply. I believe this is likely due to worsening problems in North Ghawar, though that can't be proven beyond a reasonable doubt. The voluntary restraint hypothesis would require that the Saudi's are deliberately dropping production to drive prices from the upper $50s to the upper $60s.
- H:
- Production increases again from May 2006 to July 2006, as prices first drop, and then crest in the $70s on fear of war with Iran or hurricanes in the Gulf. I interpret this as most likely the onset of the Haradh megaproject. The voluntary restraint hypothesis requires that the Saudis now change their minds and make a (very modest) production increase to try to ameliorate the price increases they have just been driving a few months ago. Rig counts continue to increase rapidly.
- I:
- Production and prices both continue to decrease. There may be scope for both explanations here, as problems continue in North Ghawar, but is also true that OPEC begins to talk of, and then carry out, small production cuts to prevent the price going too much lower than the levels they have now got used to (ie around $60). A few hundred kbd of Saudi production cuts might be accounted for this way. Rig counts have plateaued for the moment.
Let me now turn to documenting some of the things I alluded to above.
Ghawar
In response to Euan's latest post, we received a flying visit from Fractional_Flow, an experienced reservoir engineer, who provided a link to a very interesting paper as well as a few key insights. This led me to dig further into the recent petroleum engineering literature on the Ghawar field since the publication of Matt Simmon's book Twilight in the Desert. This exercise has helped a lot in fleshing out what I think is happening and I'd like to discuss what I found. The papers themselves are copyrighted and behind a paywall, but I will link to the abstracts and make some fair-use excerpts.It's also probably worth stressing here that I am not and never have been a reservoir engineer. I was academically trained in physics and computer science, and have mainly worked in the latter field. I am able to understand reservoir engineering textbooks and papers, but it's possible that lack of deep knowledge and operational experience may lead to errors. Unfortunately it seems that the world's reservoir engineers mostly work for someplace that doesn't want them discussing sensitive topics in public - but I encourage any of them to point out any errors in interpretation I might have made, and I'll do my best to fix them.
Let's start though by reminding ourselves of the basic facts about Ghawar (also see Greg Croft's summary).
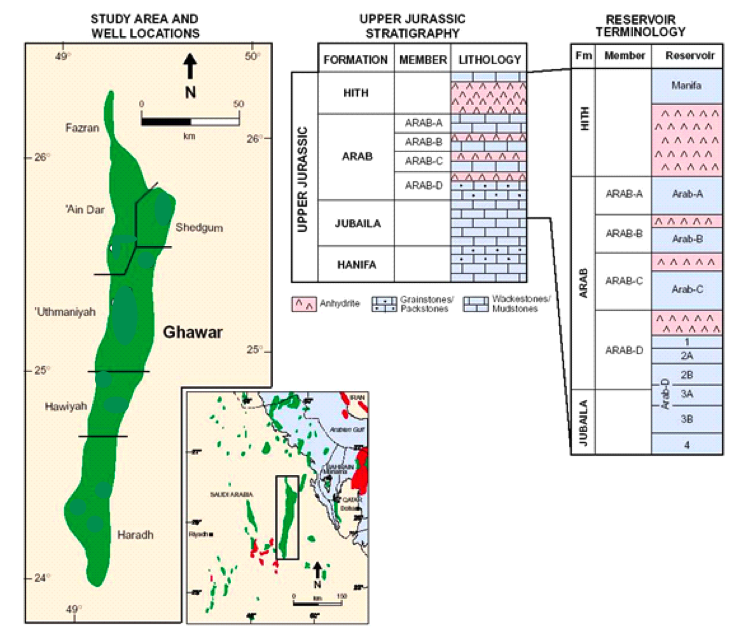
The whole structure is about 175 miles long, and around 20 miles wide at the widest - by far the largest field in the world. The oil in Ghawar is almost all in the pores of the Arab D carbonate rock shown in the Figure above (on which more in a moment). There are five major operating areas of Ghawar: 'Ain Dar, Shedgum, Uthmaniyah, Hawiyah, and Haradh. 'Ain Dar and Shedgum were the highest quality (highly permeable reservoir rock and sweeter crude), while the quality of both rock and crude tends to decrease from north to south. Accordingly, development of the field started at the north end, and each wave of new technology has tended to be applied at the top end first and then work south.
Let's look at 'Ain Dar and Shedgum first. This next picture is believed to show the permeability of the two regions. Ain Dar is the narrower longer ridge to the top (west) of the picture, while Shedgum is the broader shorter lump lower in the picture (ie to the east):

The two regions together are almost 45 miles from north to south, and around 20 miles east to west. The variable we are looking at, permeability (often denoted K) is related to how easy it is to push fluid through the reservoir rock. The more pressure drop across a given volume of rock, the more fluid is going to flow through it (just as when you suck harder on a straw, you get more to drink). Part of the constant of proportionality between the pressure and the flow is called the permeability of the rock (the other part is the viscosity of the fluid). It is measured in Darcies (after the French scientist who developed the most widely used equation of motion for fluids in porous media). Rock with a permeability of one Darcy (equivalently 1000 Millidarcies) will allow for a flow of 1 cm/s of a fluid with viscosity 1 centiPoise under a pressure gradient of 1 atm/cm. To make sense of the "1 centiPoise part", note that water has a viscosity of 1 centiPoise at 20oC. Ghawar oil is a little less viscous than water - varying from 0.62 centipoise in 'Ain Dar to 0.89 in Haradh. Highly permeable rock allows much more rapid production of oil (and of water).
As you can see, much of North Ain'Dar and Shedgum have very high permeabilities in the range of 750 mD. South 'Ain Dar has much lower permeability and is presumably far less productive in consequence. Also note the red and black regions in the picture. These are areas of very high permeability which likely allowed for the very high oil production early in the life of some Saudi wells, but also can channel large volumes of water later in the life of the field.
Data for the production history of 'Ain Dar and Shedgum together were given by Baqi and Saleri in their presentation to CSIS in February 2004 (the presentation that was essentially trying to refute Matt Simmons' concerns). Those data look as follows:
As you can see, production has recently been running at around 2mbd. This graph shows annual data through 2002. If we look at the Water Management in North 'Ain Dar paper, we get an annual production series just for North 'Ain Dar, which suggests that region was about one quarter of the total production of the whole 'Ain Dar/Shedgum north end:

Here the production data represent annual data through 2004. Assuming this data is accurate, production fluctuations in North 'Ain Dar cannot have contributed in a large way to changes in overall Saudi output through 2004 (though it is perhaps useful to note that 2004 is slightly down on 2003, whereas Saudi Arabia as a whole was up from 2003 to 2004 on an annual basis). At any rate, there is no evidence here of major trouble in North Ghawar production as of the end of 2004.
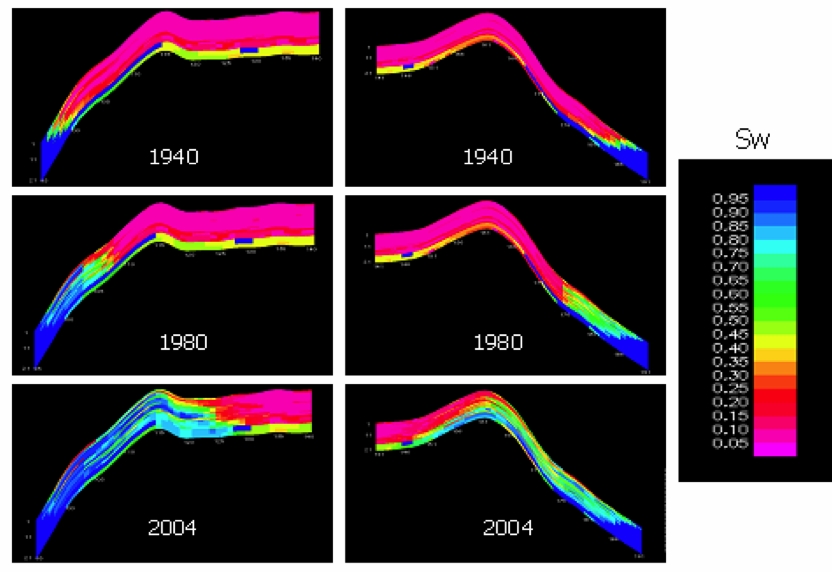
However, there are other indications in the paper suggesting that trouble cannot be far off at all. Let's look at this picture of the state of the reservoir in 'Ain Dar. This is taken from a paper titled Water Management In North 'Ain Dar, Saudi Arabia by Alhuthali et al and published by the Society of Petroleum Engineers as Paper #93439 in March 2005. Fractional_Flow pointed us to a bootleg copy that somebody put up, but if that disappears, you can get the official version behind the paywall.

This is from a numerical simulation of the development of the reservoir over time. However, Saudi Aramco history-matches their reservoir models with extensive amounts of well log data, so it is probably a reasonably accurate picture of the history of the field. The variable being plotted is water saturation - that is the percentage of the pore volume in the rock that is filled with water, rather than oil. In Ghawar, the reservoir pressure has been maintained such that there is no gas cap (the gas is dissolved in the oil), and so the pores are filled with oil, water, or a mixture. You can get the general idea of the figure - at the beginning (in 1940) the crest of the reservoir was almost all filled with pink (ie oil with less than 5% water) and red (less than 25%). As time has gone on and more water has been injected at the periphery, there is less and less dry oil like that, and instead there are green and pale blue areas which are 50%-80% water by volume.
Now, your first thought might be this: if there is 10% water and 90% oil in a particular volume of rock (pink areas in the figure above), then a well into that part of the rock would be receiving 10% water and 90% oil. Similarly, an area with 60% water and 40% oil might be producing at 60% water cut into a well into that area. However, this is not so: the difference is much more dramatic than that. The reason has to do with the physics of two phase flow in a permeable medium. If you want a mathematical treatment, try this, but let me try to illustrate the basic idea.
In a set of interconnected pores through which oil and water are being forced at pressure, the flow is too turbulent for large areas of the two fluids to separate out from one another. And yet, oil and water do not like to mix, and will tend to bead up in the presence of the other. If there is only a little water and a lot of oil, then the oil will form an interconnected network of fluid throughout the rock pores, whereas the water will tend to make small beads within the oil. Conversely, a little oil in a lot of water will result in a network of water throughout the rock, and small beads of oil within that network. Now, in either situation, the fluid that is interconnected can flow through the rock without making any change in the arrangement of beads and surfaces between oil and water. However, the fluid that is beaded up can only move by the beads physically moving around, and they are going to tend to get trapped by the rock pores.
So for this reason, in a mixture of almost all oil, the water cannot flow at all. Conversely, once there is almost all water, the oil cannot flow at all (which sets an upper limit on the amount of oil that can ever be recovered by a water flood). In between, there is a changeover in which the proportion of oil flowing to water flowing changes much more rapidly than the changeover of the actual mixing ratio. The curve that describes this is called the fractional flow curve.
For example, the tutorial I referenced earlier shows this picture for a typical fractional flow curve:
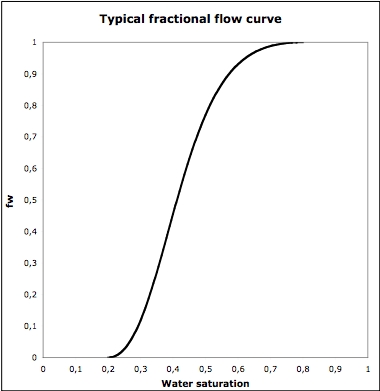
So the way to read this is that when we are below 20% on the X-axis (less than 20% water in the oil), there is zero on the y-axis (the water will not flow through the rock at all). As we get above 20% water saturation, the flow of water increases rapidly, until above 80% water, there is no flow of oil at all. In the linear region at the center of the curve, the slope is about 3.6. That is, each 1 percentage point increase in water saturation results in a 3.6 percentage point increase in water flow in the rock.
So that implies that the difference between the red regions (20% water saturation) in the simulation picture above and the green regions (60% water saturation) could be very large. That might be the difference between hardly any water flowing, and almost all water flowing. But does this abstract "typical" fractional flow curve really apply to Ghawar? Or might things be very different there?
Well, I have managed to find in another SPE paper some actual data from which I was able to infer the fractional flow curve for three regions of Southern and Central Ghawar. In a different references, I found a carbonate fractional flow curve from the United Arab Emirates.
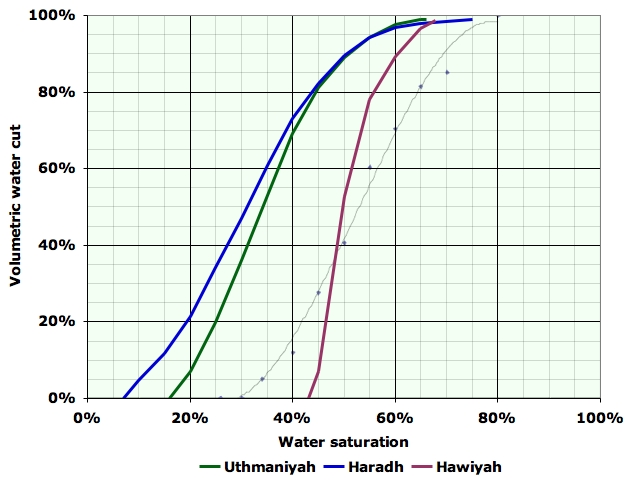
Clearly, these have the same general character as the "typical curve" above, and again there is going to be a dramatic difference between red regions and green regions in the cross sections above.
Now, we do not have quantitative fractional flow curves for 'Ain Dar and Shedgum at the moment. However, we know one point on the curve for 'Ain Dar from Alhuthali et al (Paper #93439), which reports on measurements of rock right next to an abandoned water injector well. The pores of that rock had 21% oil, 79% water. Rock next to a water injection well is bound to contain only that oil which is never going to move under any further waterflooding, and so tells us that the fractional flow curve must reach the top of the graph (y-axis of 100%) when the x-axis is at 79% water saturation. This appears to be roughly consistent with the other curves on the graph.
Thus, we can conclude that as long as there is red/pink in the simulations above, it will be possible to produce oil at very low water cuts by drilling horizontally into those oil layers. The overall water cut of the field can be somewhat controlled by making decisions about how much to produce out of the red-pink zone, and how much to produce from the watery green areas. Once the red/pink zone is gone, then there will be no way to produce oil except out of those green areas, which probably correspond to water cuts in excess of 70% (perhaps much higher depending on the exact shape of the fractional flow curve in this part of Ghawar).
Now, how long before the red zone is gone? Let me remind you of the simulation picture again, to save on scrolling:
Now, after staring at the bumps in these figures, I think I have figured out roughly where in North 'Ain Dar these two cross sections -- a) and b) -- are. I have indicated them on the permeability visualization I showed before:
These placements are not exact - they could easily be a few miles north or south of where I have shown them, but I am pretty confident that I am in the right general region. Now, the conclusion I draw from this placement is as follows: the cross sections are reasonably representative of the crest of North 'Ain Dar. As the cross sections show only a reasonably thin layer of red/pink oil that, in two dimensions, is hugging the top of the reservoir, it seems very likely that, in three dimensions, we only have a layer of roughly that thickness throughout the entire crest of North 'Ain Dar.
So how long is that layer going to last?
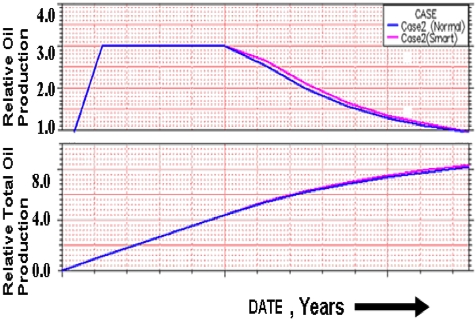
Well, if we blow up just the 1990 and 2004 pictures for the (a) cross section, that is the western flank, we get this picture:
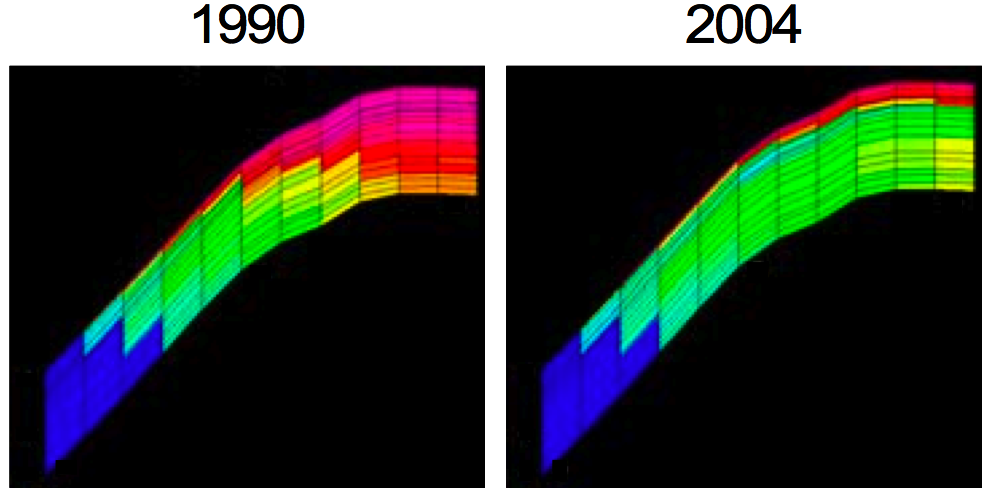
So my layer counting says that over 14 years we went from 10 layers of red/pink in the crest to 2 layers of red in the crest. And if we do the same for the (b) cross section on the eastern flank, we get this:

Layer counting here says that 6-9 layers of red/pink have been reduced to 1 layer over the same 14 years, suggesting a similar pace. So, overall, we lose a layer about every 21 months, and there were 1-2 layers left at the time of the 2004 simulation. Now, we do not know for sure whether this simulation means by "2004", "2004.0" -- the beginning of the year, or the end of the year. However, labels on simulation visualizations in other papers shows annual data with a ".0", suggesting that is the convention. If so, then we would expect the green area to reach the top of the reservoir in some places in North 'Ain Dar in mid-late 2005, and in most places there by the middle of 2007. Thus in timing, this phenomenon would be consistent with the decline in output across production zones E-I (mid 2005 through the present).
It does not appear to me that, from a timing perspective, this phenomenon is well placed to explain any declines that offset whatever fraction of the 690kbd of Qatif megaproject production came on in late 2004 and early 2005 (zones B-D). We have production data for North 'Ain Dar which do not show more than a very small decline in 2004 on an annual basis, so any sizeable decline here could not have occurred before 2005.
Euan has questioned whether an increase in water cut like this could have a large enough impact on production to explain all the declines we see. Let me try to make an estimate on how large it could be. We cannot do this with any precision from the fractional flow curve because we don't have an exact fractional flow curve for this part of Ghawar. However, there is other data in Paper #93439 which allows us estimate this. In particular, the paper contains a discussion of what fraction of production comes from behind the flood front, versus in front of the flood front. They discuss the desirability of trying to produce from behind the flood front as much as possible in order to maximize overall recovery of the oil. However, it is clear from Figure 10, that they have been obliged to produce more and more oil from above the flood front in order to maintain production. Specifically, the fraction of production below/behind the flood front is shown as follows:
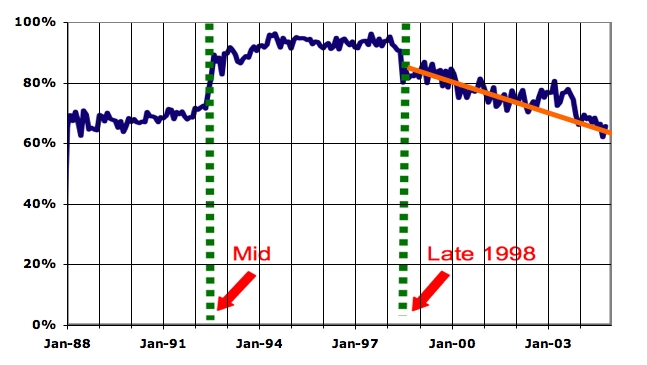
Now, this is dropping, presumably because the water behind the flood front has higher and higher water cut over time, and the water handling facilities are limited. If we extrapolate out the orange line to today, only 55% of production would be coming from behind the flood front. However, once the flood front has reached the crest (which I argue must already have happened already in most places), then there can be no production from above the flood front. This line of reasoning suggests that the flood front reaching the crest would produce around a 45% reduction in production over a period of a couple of years.
Now, we only have enough data to make a convincing case for when this will occur in North 'Ain Dar, which represented only 500kbpd of production in 2004. However, it is at least plausible, though not proven, that the same thing could be happening in approximately the same time frame in the whole 'Ain Dar/Shedgum region. 'Ain Dar and Shedgum have very similar reservoir properties, very similar oil qualities, almost identical thickness of original oil layer, and were brought onto production at the same time. So it is plausible that they have been produced in parallel, and will be reaching the end of their production plateaus at around the same time.
If this were so, a 45% reduction in 2mbpd of production (as of 2002) would represent about 900kbd (with a large, say 50%, uncertainty in that number for a SWAG at the error bar). This might be enough to explain most of the decline in production from June 2005 to the present (though we would still require some other field in decline earlier in order to offset Qatif and Haradh III). and make up the rest of the overall production decline.
Some further circumstantial evidence for this point of view comes from Hussain et al, International Petroleum Technology Conference Paper #10395, November 2005. This paper is titled Optimizing Maximum-Reservoir-Contact Wells: Application to Saudi Arabian Reservoirs and covers the process of selecting locations in 'Ain Dar and Shedgum in which infill Maximum Reservoir Contact wells (MRCs) would produce incremental recovery over what could be recovered via the existing wells. For each potential MRC (basically a horizontal multilateral), a detailed reservoir engineering simulation is done on a fine scale grid to assess the impact on recovery and the economics of the proposed well. What is interesting is that these wells (which presumably represent the best remaining opportunities in the field where there is still some localized piece of the oil layer left to go after) are anticipated to begin declining very quickly.
The new well studied in 'Ain Dar, which was "planned to be spudded early 2006" is simulated to begin declining sharply almost immediately:
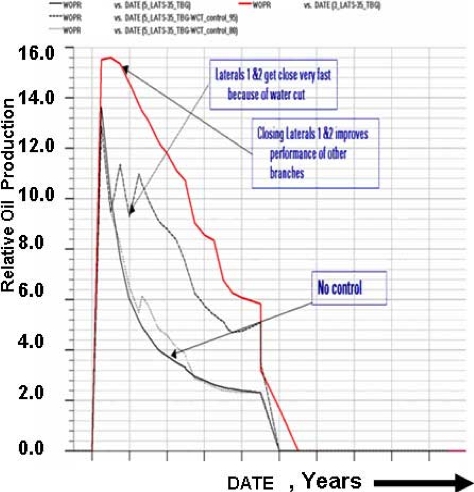
My interpretation of this is as follows: there is nowhere left that one could put an MRC into a reasonably dry oil layer anywhere in 'Ain Dar. If there was, Saudi Aramco would have illustrated their paper with that well, instead of this one, and that hypothetical well would have had a longer plateau.
Similarly, the new MRC studied in Shedgum was "spudded in late 2004", and was anticipated to be on plateau through the end of 2008, before beginning to decline rapidly:
My interpretation of this is that the last remaining spots of dry oil layer in Shedgum will be gone by the end of 2008, implying that there are probably some places in Shedgum where the oil layer is gone already.
Uthmaniyah
The situation in Uthmaniyah is less clear. There is a paper Water Production Management Strategies in North Uthmaniyah Area, Saudi Arabia, which covers some of the same ground as the North 'Ain Dar paper. However, what it particularly lacks is any production data, so we cannot estimate either how much Uthmaniyah has produced, or any trend in that production.The paper does have some interesting hints of trouble. For example, "In August 2004, additional twenty-seven high water cut wells were put on cyclic production." Cyclic production means taking wells in wetter zones of the field off line for six months at a time to allow water to settle away from the well bores, and then running them again. It's interesting that this was happening right at the start of zone B, when Saudi production stopped rising even as OPEC was losing control of prices. However, 27 wells, which were presumably below the Saudi average at the time of 6kbd each, can only represent a number not much larger than 100kbd, and perhaps significantly smaller. So this is not evidence of much unless it were a harbinger of larger problems.
The paper does show cross-sections of a reservoir simulation again:
Several features are interesting. It looks as though there is more dry oil left in Uthmaniyah than in 'Ain Dar. However, it also looks like it is harder to flood uniformly: the simulation shows some streaking of water breaking through the oil layers that was not evident in the Ain Dar simulation. Some explanation for this is found in the fractional flow curve, which we actually have for Uthmaniyah:
As you can see, the fractional flow curve for Uthmaniyah is not too nice. Once we get out of the pink (ie above 15% water saturation), water movement starts, and by the time we are into green (above 50% water saturation) water cut is up to 90%. Thus production outside of the dry oil will be a slow business in Uthmaniyah, and ultimate recoveries are bound to be lower. If we blow up just the 1980 and 2004 pictures, we can try to estimate how much oil is left:
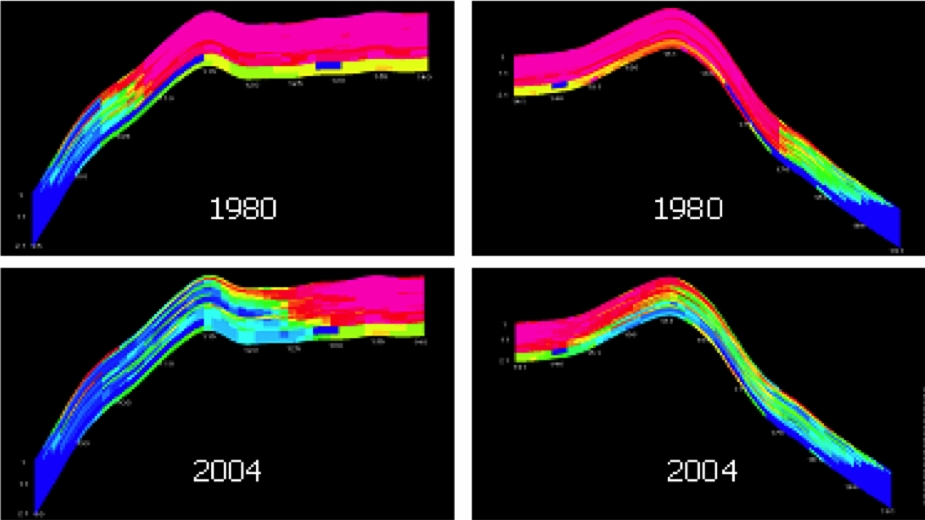
Eyeballing this, and assuming these profiles are representative, it looks like about a quarter of the pink oil there in 1980 was still there in 2004, suggesting plateau might be maintained for another 8 years give or take a year or two (and modulo periodic breakthroughs from those streaks). After that, it appears that water cuts will start to rise rapidly and within another five years production will inevitably decline greatly as there are only yellow and green regions to try and produce from with very high water cuts.
A Note on Well Productivity
Finally, I wanted to comment briefly on Euan's piece on well productivity, which I think might have been overly persuasive to some people. The first thing to note is that the main reason for the high well productivity of Saudi wells is that the rock is exceptionally permable by global standards. This allows a relatively small number of wells to drain a large volume of rock. It does not mean that once that rock has no dry oil in, production cannot decline rapidly, or that lots of further drilling into the depleted reservoir will necessarily do a great deal of good (it is noteworthy that the Saudis are putting in a fairly small number of very carefully planned wells in North Ghawar to extract the last oil they consider worth going after, rather than putting in large numbers of wells which would do little good).The second thing to note is that the OPEC data Euan used is annual. Not only that, it ends right as the alleged problem is just getting going. This conceals any signal of the problem in the data. I did an exercise to infer what the monthly well productivity would look like through the end of monthly data. I did this by assuming that well retirements occur at the same rate in the monthly data as they did on average in the OPEC annual data from 2001-2005. I further assume that the rigs Baker Hughes counted in Saudi Arabia drill wells each month at the same average rig productivity as the OPEC annual data show from 2001-2005. I linearly extrapolate the ratio of oil to NGLs to continue as it has been going. I applied this procedure from the beginning of 2004 on, and its reasonableness is attested to by the fact that it predicts the OPEC reported number of producing wells at the end of 2004 and 2005 to better than 1%. (Further interpolation into the next year is based on the OPEC actual, rather than the monthly interpolated estimate from the prior year).
With those assumptions, the well productivity graph looks like this:

As you can see, the well productivity shows evidence of an alarming decline starting in mid 2005, and accelerating through 2006. This is consistent with my overall hypothesis that declines in Saudi production are in significant measure forced, rather than voluntary.
The Future
Does this allow us any greater confidence in predicting the future? Probably not too much. On the one hand, it appears that Uthmaniyah may not imminently follow 'Ain Dar and Shedgum, and that the worst of the rapid damage in north Ghawar may already have occurred. On the other hand, the data appear to me to suggest that 'Ain Dar and Shedgum declines are not likely to be sufficient to fully explain the declines (net of megaprojects) that we have observed in total production. One possibility is that some other fields or regions of Ghawar are also declining (eg we know next to nothing about Hawiyah). Another possible explanation is that the redevelopment of Qatif and Abu Safah was largely a failure. A third possibility is a hybrid explanation in which some of the late 2006/early 2007 decline is voluntary as price has sagged below $60, over and above the forced decline. That might allow for a partial recovery of production this summer. However, this last would be somewhat inconsistent with the fact that Saudi Arabia's Asian customers have been put on allocation.Time and further investigation are required.
Footnotes
- The water cut was calculated as Krw/(Krw+Kro/Fv), where Krw is the relative permeability for water from the figure, Kro is the relative permeability of oil also from the figure, and Fv is the oil formation volume factor from Greg Croft.
Contact
- Content: editors at theoildrum dot com
- Tech support: support at theoildrum dot com
License

This work is licensed under a Creative Commons Attribution-Share Alike 3.0 United States License.
Great work. Im wondering how close we are to the what the engineers in SA know? Do they know a lot more? Details for more of the area probably. I suppose they read this :)
However, Iam personnaly convinced that we have some problem with oil production world-wide, to get enough product on the market. This year.
So, again, are we (TOD) gonna spend another day debating this and that of what is wrong or right above, or do we want to discuss some larger points. Like, should we inform more people about peak oil? How is that done? Is there a printable sheet to hand out/pdf to people, explaining the basics?
What will happen 2007 or 2008 if SA reduces output down to say 7 mbpd? Ideas?
"So, again, are we (TOD) gonna spend another day debating this and that of what is wrong or right above, or do we want to discuss some larger points."
You've got to be kidding? Yes, of course, the public should be reached. But SA peaking is not a large point? TOD has people who know about this stuff and can argue it. What could possibly be of greater interest? There's no conflict between the two goals.
Reaching the public is not easy when you have spinmeisters like CERA preaching rosy outlook into 2030 and beyond. The sad truth is that "jerkin yerkin" and his band of merry makers have far greater influence in a 2 minute intervies on MSM with the clueless public and policy makers in denial than two years of TOD. The public will not be ready for facing reality let alone a change until we hit a wall.
soleman and davebygolly,
Agree with your points, and to me, Stuart's work in an EXCEPTIONAL article, well worked arguement, and great documentation is EXACTLY the stock in trade of what TOD is and why, even when I get pizzed at some small point or another, I keep coming back.
As to Yergin and the CERA merry makers, the problem is worse than that: CERA could be easily dismissed if the EIA of the U.S. Department of Energy and USGS did not basically back him up. I once argued that they should have to go before Congress and testify under oath to thier assessments once and for all, and if they turn out to have based thier numbers on thin air, be held accountable for them. The EIA recent long term outlook gives fuel and energy costs almost across the board as being no higher out to 2030 than we have already seen:
http://www.eia.doe.gov/oiaf/aeo/growth.html#prices
(!!!!)
Add to this the Saudi claims that they have it covered and ExxonMobil claims that there is no sign of peak anything and you see the problem. Those who accept the need for concern are having to persuade the public, investors, planners, etc. to bet against ALMOST EVERY MAJOR ENERGY POLICY INSTITUTION IN THE DEVELOPED WORLD. An uphill fight to say the least, and now almost impossible, due to bankers and policy makers sourcing the Department of Energy stats to get information, investment and funding for alternatives and mitigation will rapidly dry up.
General Motors now says that the plug hybrid car the "Volt" will possibly never be built. Volvo has essentially ignored its magnificant lithium battery electric car. Ford has done no further development on it's hydraulic hybrid truck/SUV which was developed in conjunction with Eaton Corp. and the EPA.
Why? If one assumes a petroleum price at or below $75 per barrel out to 2030, non of the above technology makes any sense to develop. It will simply not have a customer base.
Thanks Stuart Staniford, EXCELLENT ARTICLE, one for my "saved" file, as I have said before, if I have to accept someones numbers, I would accept yours long before I accept CERA, EIA, or USGS numbers, which are to me as screwed up as soup sandwich! :-)
(now, if we can resolve just how much oil is going to come on line from the Khurais field, the empty quarter, and offshore, we could get a clear picture of what is going to happen....until then, it's still a shot in the dark...:-)
PREPARE FOR ANYTHING.
Roger Conner Jr.
Remember, we are only one cubic mile from freedom
Hi Roger,
Thanks and
re: "...An uphill fight to say the least"
Did you see Richard Heinberg's essay about his experience talking to EU people? http://www.energybulletin.net/27278.html
It's hard to say, is my take on it. Uphill...yes. (or...no?) And...how steep? We don't really know, do we? (In fact, this seems to have a much greater uncertainty factor than any reserves discussion. Despite many people's firmly held opinions.)
re: "...It will simply not have a customer base."
In regard to policies though, such as stopping some subsidies and implementing others...for eg., ag reform. and better ag policies (as perhaps touched on above)...the "customer base" perhaps can be changed. Just as it has been manipulated in a real sense in the past.
This is a great article on water flooding.
If a field is rested for a decent period (no idea how long) in conditions where it has been producing with a significant and rising water cut, does the oil permeate to the top over time so that production can once again proceed from drier oil at the top?
If so, the Saudis, with so many fields must be able to do this, as Euan suggests, but maybe their ability to control the situation, as Stuart points out so eloquently, is "in decline" as well.
Saildog, you ask a great question and I am not sure of the answer. But I do have a couple of comments. "Resting the fields" is a term I have only heard on this, and other, forums. I have never encountered the term in any technical literature or on any book about peak oil or oil production in general.
The only thing I think resting a field might do would be if coning had occurred then shutting the field down for several years might mitigate the situation somewhat. That is oil from the sides of the cone might migrate in and push the cone down some but I am not at all sure about this. Just guessing I would tend to doubt that resting a field would help the coning very much.
But I would bet that it would not help the water/oil mix one bit. I think it would take decades, or even centuries or more for the oil and water to separate inside the reservoir.
However I would just love to hear from someone who does know what the hell they are talking about on this subject because I sure as hell do not. But never having encountered the principle anywhere except on fourms such as this, I tend to doubt that it is a widespread practice.
Ron Patterson
ron, i agree with you to an extent. my first reaction when i read about "resting" the wells here for the first time was relative to water coning. my experience is that if/when coning occurs, shutting in the well for a time will give an instantaneous improvement but for a very limited time.
however, the saudi's may be "resting" the wells to their benifit. 1) resting the wells has the same effect as production at a lower rate. 2) the combination of high porosity and permeability, reservoir stratification and steep dip may actually result in gravity segregation of the oil and water (some on here dismiss this idea out of hand). 3) during the shut in periods, water may "imbibe" into the lower porosity rock and displace some oil "into the fairway". imbibition is very effective in displacing oil, although limited to a few % of pore volume.
At least in Uthmaniyah, the Saudis explicitly have a bunch of wells on cyclic production, where they produce for 6 mos and then rest 6 mos.
Thanks, Stuart,
re: Do they say explicitly why? Or, do you know (for sure) why?
SPE 98847 saith:
Stuart, et all,
I thought you might be interested in this story. Though its use for oil fields may not work one day, it is interesting and its about "flow" of liquids and what forces can be used to act upon that flow
http://www.livescience.com/technology/070327_laser_jet.html
"Light is actually pushing onto us slightly. This effect is called radiation pressure," Zhang said.
This gentle pressure generated by photons—particles of light—ordinarily goes unnoticed. But the liquid used in the new experiment—a soapy mixture—has such an incredibly weak surface that even light can deform it. It created a phase change that's a bit like how shampoo turns to soap when you add water, the scientists explained.
The newfound technique might offer a new way to control the flow of fluids through channels thinner than a human hair for biomedical and biotechnological applications, the researchers said.
Quid Clarius Astris
Ubi Bene ibi patria
In US wells using pumps, resting a well might simply refer to allowing the oil to seep in and fill the borehole. I know a lot of stripper wells operate on a few days a week (or month) type of schedule. Like you, Ron, I don't how the 'resting' would affect a high-production water drive oil field like in KSA, which is obviously going to be quite different than pump driven stripper wells.
The same issue has come up with regard to the Russian wells that had several years of 'resting' before being put into high production again. I suspect it is a combination of geological factors such as oil migration (imbibing) and technological factors such as horizontal wells, etc. that brought about the second Russian peak.
Assuming that Russia starts reporting lower crude oil production this year or or next year, IMO it is very likely that we may see as much as a 50% drop in net oil exports by the current top 10 net oil exporters, within a five year period. Note that the UK went from exporting one mbpd in 1999 to zero exports (a net importer) in 2005.
In any case, I estimate, based on some assumptions, that net oil exports by the top 10 fell by about 8% from 12/05 to 12/06.
What to do? Start thinking about how you are going to feed your family. While we can hope, I don't expect to see any policy changes in the short term, especially as ExxonMobil and CERA are telling us that we don't have to worry about Peak Oil for decades to come.
I recommend ELP--Economize; Localize & Produce. I think that it is a very good idea to get joint venture groups together to buy small tracts of land for organic farms. I am going to expound on this in a planned article next week.
I think we're screwed too. But in the case of KSA, I can see them maintaining exports even in the face of declining production, at least for a time. Given a choice between money and a rioting population, I think they try the riots.
I think westexas's point about food is crucial. Most people COULD get to work (assuming they still have any) by foot, bicycle or public transport and just have to put up with the inconvenience and extra journey time. Most people COULD get by with a lot less fuel for heat, etc. than they use now, with insulation and tolerating lower temperatures. They COULD do without (be happier without?) the endless power-hungry gadgets they currently have. You can't do without food, in fact if life is generally harder you need more.
It's no coincidence that the theme of the 2007 Soil Association (UK organic farming body) conference was peak oil. In that conference, Richard Heinberg said that UK would need 10 million more farmers (or the full-time equivalent thereof) within 20 or so years. That's at least a quarter of the working age (18-65) population.
A few days ago somebody mentioned that most jobs in W. Europe and USA were to do with people moving making, selling, moving or marketing goods that were totally inessential for everyday life - and asked what would these people do when there is a peak oil induced recession and nobody is buying them. According to Heinberg the previous paragraph contains the answer. What young people aspiring to comfortable office-based jobs would think, when told they have to spend 10-20 hours per week doing manual farm work is another matter. It's an almost surreal prospect and as Heinberg says, growing food takes some skill so would be a formidable reeducation task.
I have been a grower for a wholesale nursery for 21 yrs and have had my own now for 6yrs now (27 years total). I cannot stress enough that it takes time to learn how to grow plants consistantly, even with a horticulture education. I maintain @ 3 yrs to know how to grow a crop, again the key word here is consistantly. Besides different genus & specie, each "cultivar" (cultivated variety) has different requirements, nutritional needs and is attacked by different insects and diseases. It would amaze you how specific certain insects are to what they like. Crane fly lays it eggs in - Bellium munitum. Root weavil lays its eggs in -Galium oderatum. Even if both plants and insects are in the same greenhouse.
Like credit ratings plants have a 3 legged "disease triangle". susecptable host plant, correct enviromental conditions(temperature, humidity), and the disease or insect.
Insects act as vectors(transmission) for disease by carrying spores on thier bodies as they move about.
Under perfect disease conditions and with a highly susceptable host plant it is almost impossible to control diseases - hence chemicals.
Chemical(including organic spray type controls) application can be done preventatively "if" you understand the necessary conditions, disease, and the plant.
I cannot, cannot stress enough that it takes time and paying attention. If you screw up one year you might not get the chance to learn from your mistake until the following year. Hopefully then you will have made the right decision or you might have to wait until the next year again.
IMHO it takes 3 years to be consistant(consistant as defined by me as low losses, high quality).
Best D
D,
I was only half kidding when I suggested to a friend of mine from Africa that we should have a "Reverse Peace Corps" plan, where African farmers come over to the US to show American college students sustainable farming practices. As I said last year, at some point we will probably see unemployed college graduates competing with migrant workers for agricultural jobs.
I think that a good line of business may be running classes on how to set up your own Victory Garden.
I have forgotten the exact numbers, but before the Soviet Union collapsed, I think that tiny private agricultural plots accounted for something like half of all food output, while accounting for something like 5% of the arable land.
There's a huge collection (1,849) of book learning online at Cornell U. called Core Historical Literature of Agriculture. I can attest from owning an 1911 set of the Farmer's Cyclopedia that there's a boatload of knowledge on how to farm without fossil fuels and chemical fertilizers.
That is a fabulous link. A gold mine...
Westexas-thx your continuing input. OK by me you might repeat items...how else can newcomers catch-up?
Perhaps adapt Canada's view and pay well gollege students to do "manual labor that is valuable and productive...like planting zillions of seedlings [Canada's reforestation programs]. When did idea of manual labor become degraded? Who decides what is "skilled" and "unskilled"? Our food supply is victimized by narrow interests.
I dug, planted and harvested in a Victory Garden 1943-1947. The workability of that included full employment. No unemployment. So no hungry and desperate mouths to steal the fruits at night [except us little kids]. Very different now.
WT I can believe that with smaller plots of land. I know alot of farming includes the use of pre and post emergent herbicides. I have never found a herbicide yet that you can apply that will not stunt the crop you are trying to "save". "I want this plant to die right next to this plant I want to live and grow healthy" has never made sense or worked for me. I watched a $10,000 crop slowly die over 1.5 yrs using "recommended rates" of a particular pre-emergent herbicide. I haven't used them over plants since and do not recommend it. Boy was I mad, I'm not real popular with chemical co. rep's at trade shows.
The attention paid such as by the poster below on his peppers makes for bigger and better yield as skills are learned. Paying close attention to the plant and doing what it likes, and not what you like, is most of the battle.
I just made a similar realization. I tried raising a garden last year with minimal success. I made several mistakes, some of which I'm aware of, but some that I'm still trying to figure out. It struck me that when you only get one try per year, the learning curve is very long.
Lesson from first year:
Peppers like multiple days of >100*F. Herbs do not.
One good thing about global warming. My peppers and tomatoes will get better (I have an altitude problem)
I tried raising a garden last year with minimal success
I had the exact opposite experience. I basically threw a bunch of seeds down on some compost I had made and got huge, productive plants, no (and I mean not a one) insects, and no diseases. I basically didn't even have any weeds.
Of course that means I won't be able to grow a damn thing this year.
That style of gardening is no joke. I highly recommed all read the books of Masanobu Fukuoka of Japan. If you look you can find them in English.
His goal was to farm in the most natural way possible, with the least amount of effort, and the largest results.
In its particulars it is quite sophisticated but the basic story is this:
Throw some seeds around. Let the veggies grow like weeds.
In practice he uses "seedballs" so the seeds aren't eaten before they sprout. No tilling, no planting, no weeding, no chemicals, no fertilizer (except some natural compost), no pesticides. Just throw some seeds around, wait, and harvest. Mix up 100+ varieties of things you want to eat. If you toss this mix all over the place, the most appropriate plant will probably begin to thrive in the most appropriate place.
Since this technique requires very little work you can cover large areas with it. Then, even if your initial production is very low per acre, in total you can create large amounts of food.
In time Fukuoka was able to reach some of the highest yields in the world by any method, while doing almost no work. But this takes many years of fine-tuning.
I actually kind of practice this, without any refinements, and it is a valid approach - except for the insects. It would be interesting to see what his approach towards them was.
Picking off the potato bugs, and destroying any egg infested leaves works, for example, but it does take some time.
His approach was basically to leave them alone. After a while, a predator of the insects would appear. He said it was a different one each time. He was adamant that a generally inviting environment (no chemicals or pesticides) be maintained so that insect predators would appear.
He also found that the damage often looked worse than it was. In his case, he had "rice blast," which destroyed rice. His fields looked like a total loss but he found that yields declined only by about 30%. Not all the plants were affected and the ones that weren't tended to yield more because they had less competition.
One predator of insects on vegetables is chickens. He raised chickens, which ate the bugs and produced eggs.
If you look at plants in nature, in a forest or wild field for example, there are of course insects but the plants are usually healthy. He strove for this state in his "managed" fields.
Two of Fukuoka's Book:
* One Straw Revolution: The Natural Way of Farming.
* The Natural Way of Farming: The Theory and Practice of Green Philosophy.
are available at
http://www.soilandhealth.org/01aglibrary/01aglibwelcome.html
BTW, the above is a FANTASIC resourse.
If anybody knows forums for people practicing Fukuoka's methods, I'd like to know about them :-)
Try
http://fukuokafarmingol.info/farchive.html
Peter.
Most plants like moist yet well drained soil. 2nd to that is what you have discovered - sun. Location is big, you can kill or severely retard the growth of a plant with not enough or too much sun light. If you have a location for your peppers with reflected heat/light, be it off off concrete,a fence,a wall, or whatever that will help. 1/2 day of afternoon sun is very, very different to a light/heat sensative plant from 1/2 day of morning sun. Loose dark colored soils warm quicker than a light colored, dense, wet soil. Try placing white (plastic) buckets between plants to reflect light. Use a (plastic) milk jug with a small hole in it to 'drip' water plants- a great way to save water and reduce weeding. Built in handles makes for easy carrying.
I'm not a fan of (light colored) straw mulches. They might be good in southern climates but here in oregon we need warmer soil so I prefer dark mulches to collect as much heat as possible. Small differences I know but they do matter with some plants or locations.
Best D
@Bman
It takes several years to figure out gardening. Almost nobody gets good results the first year(s) but rest assured, you'll get better at it.
Have your soil analyzed at a laboratory while we are not (very far) over the peak. I had mine analyzed because cabbages and unions failed mysteriously and it appears micronutricients were missing. So I am adding volcanic stonemeal, compost and borax this year. From what I've heard this is a very common problem for soils that have been used a while for agriculture. Even the rules for organic farming allow for artificial micronutricientfertilizer to be added to the ground. Adding a lot of compost will probably prevent micrionutricient deficiency to a certain extent.
Re: borax,
Warning TOD readers use this extreemly sparingly! We inject ONLY .33 ppm(parts per million) to prevent deficiencies. We disolve 1 lb laundry borax into 5 gallons water and then take only 1 pt. of this solution injected into 1,000 gallons of water (= ratio 1:8,000)to get our .33 ppm. This stuff is toxic to plant life in the wrong concentrations.
Boron(borax) can be used to treat wood against wood boring insects or as a soil sterilant it all depends on the rate.
Get a soil test done. Most micro nutrient packages have boron already included.
That's right: Don't add borax if not explicitely adviced. I only do it due to advice on the grounds of soil test. It is a problem apparently typical for the sandgrounds I'm on.
My point was: Have a soil test.
@Bman
Second advice would be to start gardening for the love of it, not for peakoil scare. It greatly enhances the joy you get from it (You don't know happiness untill your first potatoe harvest), and joy is what you need for prefecting your skills in gardening.
My husband has been growing grapes, ornamentals, and food for many years and is considered to be one of those "green thumbs." But nearly every single day he runs across something he didn't anticipate or some new bug or disease that he has difficulty dealing with. It is a continuous learning process. I'm trying to wean him from chemicals, but it is very difficult. The best way to keep the chemicals and bugs down is to build a greenhouse that is capable of keeping out most pests, but that doesn't stop the diseases.
Anyone who thinks they can just wait until things get bad and then plant a garden to feed themselves is in for an unpleasant shock. Get started now and learn how to save seeds--it may someday save your life.
I couldn't agree more about starting now. A few years ago I posted a year-by-year time-line on another forum on just how long it takes to get even close to self-sufficiency. FWIW, figure seven years: 2 years taking appropriate classes and 5 years to get everything in place.
I've been gardening for close to 40 years including several as a certified organic farmer (small-scale) and I'm still learning stuff. One thing I've been doing for the past couple of years is converting all of our veggie growing area to Terra Preta/high carbon soils. I make my own charcoal from limbs leftover from firewood cutting.
How is the terra preta/high carbon soil working out? Pluses? Minuses?
Hi Cheryl,
I started with one raised bed (150 SF) 2 1/2 years ago. I first heard about Terra Preta on the Energy Resources forum and after doing more searching became intrigued by it. (FWIW, several of us have posted links on TOD so anyone interested can do a search.)
I was especially interested in its ability to hold phosphorous. My initial plan was to use winter wheat and grow it crop on crop since wheat won't head out without adequate P. I went out and bought 150# of mesquite charcoal at our farm supply, ground it (something I would never do again - messy!)and set up three sections. One was the control, one had 2.5% (by weight) and one had 5%. This test is still ongoing.
However, I began to add (and actually steal) charcoal from our wood heater to add to some other raised beds last year. Our crops looked the best we had ever seen until the wild pigs wiped them out. In any case, I was sold so, as I mentioned above, began using our unusable limbs to specifically make charcoal. Most of the limbs were 1 1/2" or less in diameter since I cut up bigger stuff to use in our wood cook stove.
In the past I would just make one big pile (usually 40' long, 6' high and 8' wide), light it up and be done with it. This year I made little piles that were about 5' high, 6-8' long and 4' or so wide. Since I don't have water where I burn, I raked the hot coals out and shoveled them into metal pails and popped on a lids. One fire yielded about 8# of charcoal This wasn't a lot of work but it WAS really hot. It also took a LOT more time. I will continue doing this and adding charcoal for the foreseeable future.
Again, I am absolutely sold on this! However, I think it is only viable for people like me who have wood to make charcoal. In one of the articles I read it indicated that the old Terra Preta soils had around 10% charcoal so it would cost an arm and a leg to buy it.
I'm only converting about 1,000 SF at this time. If society doesn't collapse in the next five years or so, I'll start converting our remaining beds that are terraced into a hillside. That's about another 1,200 SF. I'd also like to see what happens if I add it to the soil of our fruit trees, berries and grapes but that's long, long term.
Todd
Todd, that's great (and quite interesting/useful) info! As people read these things, I wonder if they start to really grasp how labor intensive small scale farming is...especially with minimal use of petrol and modern pesticides.
I'll print this out and also check out the links. It's amazing the wealth of info you can find on TOD.
We still have about 50 mac nut trees and Gary prunes them back every year, so we too have wood we can use. Unfortunately, we also have wild pigs here that love our mac nuts (as do the rats). Gary saw a huge sow and 9 piglets the other day up on the highway--not something most folks usually associate with Hawaii.
Mahalo!
Cheryl
Hi Cheryl,
Thanks for the always interesting glimpses of "Big Island" life.
re: "...(as do the rats).
Watch out for the rats. (partial :)) (If you read the link below, you'll see why.) Terry Hunt's work is on the complexity of eco-systems - or, the particular Easter Island one, anyway - and its failure...if you haven't seen this, you may be interested: http://www.americanscientist.org/template/AssetDetail/assetid/53200?full...
Well now, that's pretty creepy indeed. Rats are a big problem here--they not only eat the nuts, they love to nest in the roof overhangs. Since most of us rural folks are on catchment for water, having these nasty, incontinent critters contaminating your water supply is not good. Rats are a big source of disease on the islands--like leptospirosis. There is so much food everywhere that they thrive big time and if you add in the large number of dogs and cats that are fed outside and the problem just multiplies.
Americans have had it really good for a long time. The move to HI was my first exposure to anything like our ancestors may have lived. We are on catchment and need to keep our roof, gutters, and tanks clean. Whenever the power goes out, we lose our pump and running water. That means you can't even flush the toilet unless you carry buckets of water. And since there are no street lights, it gets VERY dark when the moon isn't out or the cloud cover is thick. But the darkness also makes for some astounding night skies and amazing lightning displays. The power does go out a lot during storms, and the satellite dish loses its signal multiple times per day.
Hi Cheryl,
Yes, night sky is so amazing. It's wonderful you have that.
I had no idea about the rat problem there. I'm curious what county health (or others) have to say/do about it? I wonder if it's worth doing some looking into it...? (Just trying to be helpful.) (I suppose the cats are afraid of them, too?)
Hi Aniya,
This will have to be my last post on this thread. My 3rd world DSL is just to slow to load and I don't want to make yet another pot of coffee.
The county health dept is pretty up on all of it and they do try to educate the public. But it appears a lot of the public doesn't want to be educated (like so many other things).
The one real stunner we found here was the number of cats and dogs. Most homes have 2 dogs, 3-5 isn't uncommon, and some are essentially kennels. Not only do the owners leave food outside (which the rodents love), but many of the owners don't clean up after their pets, and the worst ones seem to be the transplants from the continent. I guess they figure that if their dogs feces dried up in the desert and didn't cause a problem, then it is of no concern here.
But this is the tropics, and the feces are a huge problem. They stay warm and moist, and the minute the hit the ground the parasites are entering it. It's pretty gross, but they have a huge problem with dog dung flies here. They lay their eggs in the feces and feed and hatch in it (along with everything else). Then the other parasites attach to the feet of the flies and they transport the parasites everywhere. They get pretty thick, especially in the summer. All you have to do is have one land in the right place and voila, you have a parasitical infection. It is next to impossible to avoid unless you just don't go near the garden areas. When you are surrounded by thousands on a daily basis, you are going to get something. We did. The dog dung flies also like to land on mucous membranes, which is a direct route for infection. They love wounds, and will land on them and actually rasp away scabs. Very nasty critters, but you can't talk reason to most of the dog owners as they are in denial. Does that sound familiar?
I suspect that when the economy crashes, some of these folks (many are on public assistance) will not be able to support so many pets and the problem may rectify somewhat over time. I hope so as the dog dung flies had to be one of our biggest disappointments. There was one other, but I won't get into that now. It's also about dogs and what many owners let them do INSIDE the houses. Buyer beware.
I agree about the long learning curve. The first year I put some seeds and plants in the ground and had a great crop. The next year I was plagued by Japanese beetles, and a groundhog and a large limb which had fallen after a high wind storm and crushed several of my heirloom tomato plants. I just checked my fruit trees and the deer have eaten many of the branches this long winter. Who knew they would eat branches of apples, pear and plum trees? Now, I have to add yet another fence to keep them out. I'm just lucky to have started in time to be able to run to the hardware store and spend yet more money on items shipped from the other side of the world so I can keep the rats on long legs with white tails away from my fruit trees. The greenhouse is on order (20x48 feet) and I will be following Eliot Coleman's Winter Harvest which is low-tech winter gardening (I live not far from Kunstler despite my account name). I've gotten the canning down pretty well, and sauerkraut too, which is healthy and awesome tasting. Also, food dehydration is coming along. After drying some orange peels I made some pretty effective tooth powder for just pennies. As I read Stuart's wonderful post about Saudi Arabia I'm thankful I started when I did. It takes time, commitment, money, patience, intuition and a sense of humor to grow food!
I use almost zero chemical sprays. The few I use are nontoxic and mostly a light powder dusting for cabbage worms.
I think you might be speaking more of greenhouse conditions than gardens out in the open.
My gransparents also raised huge gardens and never had the least bit of chemical sprays.
I have been gardening for 55 years(at ten I had to help on the farm in gardening,picking tobacco worms,digging potatoes and so on). I raise fruit,berries , corn,potatoes,beans,cabbage,cucumbers,beets,cantaloupes,tomatoes
,eggplant and the list goes on and on.
I see it entirely different than you do. Granted it takes time to learn the essentials of gardening but not that long.
If you spend and hour each morning and an hour each evening ,in your garden, then you learn fairly rapidly.
In each part of the country(USA) certain varieties do better than in other locations. This is the stock that the hardware stores in the country carry. Such as black-seeded simpson leaf lettuce. I found none in N. Carolina but we grow it profusely here in W. Ky. Same with peas(crowder,blackeyedm,etc)...Mississippi Pink Eye Purple Hull are the best for my climate and soil. It took me one trip long ago to find this out. I stick with it now.
A very simple trick. Shove tobacco sticks in the ground around the garden(a pole about 5 feet long) the bluebirds and others will light on them and then fly down to harvest insects.
Tomato worms? You simply pick them off. For cabbage lopers you put netting over the plants.
This is not rocket science. We(mankind) has been doing this for a very very long time.
You are likely scaring a lot of folks with this comment. Just go buy so Ruth Stout books or peruse old Mother Earth News. Its not that hard. It is very hard work but hey...better than paying money to sit on an exercise bike and watch Oprah.
Airdale...not being pissy about it..just saying the way it is for me and all the rest of the folks here. Maybe in California of New Yawk its different. I don't live there. I live where the soil is very rich and the rain is plentiful.
NOTE: This whole thread should have been on a drum beat and not going OT on a subject topic. Sorry Stuart. I posted before I realized it. The subject of gardening I doubt will ever be a Subject on TOD but thats why DrumBeats exist.
Hi airdale,
Thanks, and at risk of adding tangent length to Stuart's post...
re: "The subject of gardening I doubt will ever be a Subject on TOD but thats why DrumBeats exist."
Well, perhaps you could write up a short article and see if the editors would run it? It looks like it would generate interest and comments. It could well tie in to ag/energy policy and other issues, as well. Many people might have ideas. (I know I have some I'd like feedback on...)
Hello Aniya,
Due to my recent prolonged trip to N. Carolina I am way behind on my planting and time is very short. If your climate is like mine and with the nice dry spell we are in , you should have seed potatoes already in the ground, onions in,greens ditto and the corn as well, cucumbers too. Peas and beans can go later.
Many large rowcrop farmers here have already started with corn. The rest are running like mad.
Usually here we get a small window of good dry weather then it starts with the spring rains and you might not get another chance until quite a bit later. Earlier crops always beat out of a lot of the insects. When the deadly heat of July and August arrive you want to have already put up much of your produce and not be out sweating in the garden. The ground then gets fairly hard to deal with unless you water a lot and mulch. I had all mine done by July last year.
Every ones climate varies and dictates a lot of what must be done and the timing. One size doesn't fit all. Therefore I can't postulate too much for various regions.
In the older days we had a different environment. Free ranging chickens ate a lot of insects. Animal manure was plentiful. Child labor was there, now its almost a crime to have children work at home doing chores. Everyone pitched in and now you can't even ask others to help. Pretty hard for one man or one woman to put out a large garden yet I do it and in fact this year two. You have to almost love it. If you find it menial labor..well too bad. Its very healthy in fact and the results are extremely healthy food.
Good luck...again sorry for being OT but I wished to give you an answer. My advice. Start a smallish plot and grow it each year. Make some compost heaps. Find a source of good mulch(moldy hay,etc). Cruise the countryside and when you see a nice garden stop and talk and ask those tending it. Talk to those who set up roadside stands. Take a soil test of your soil. Amend it with lime as need be. Bring up the fertility. Poor fertility will kill you. Buy a wood chipper/mulcher and collect leaves/deadfall and brush to make mulch. Never bag and throw away your lawn clippings.
On and on it goes. Make some cold frames. A nice small cheap greenhouse of the south side of your house. Get an early start or grow in the late fall in the greenhouse. Can and preserve everything you grow. Canning jars packed via a pressure canner will keep a long time. Tomatoes if waterbath canned need to have lots of acid to can else must add some, like lemon juice or citric acid. Hybrid tomatoes many times do not have enough acid. Read up on botulism and processing. "Putting Food By" is a very good book to have. A water bath canner , a means of dehydrating , and a pressure canner is very nice to have. You can even use these over wood fires. Canning fruit is quite easy and keeps well. Also think of saving your seed. It might become very very precious. Let some plants go to seed then. I understand many hybrids will produce 'true to form' ..as per what others have told me. I know Jet Star tomatoes do and they are hybrid I believe. Not sure of the acid but many can them or make tomato juice. Bad canning can make you very ill so here in the south we cook our green beans a long time.
If you are thinking of freezing produce then consider what you will do when the grid starts to falter. A good root cellar to prevent freezing in the winter is nice and many here still use them. Just a hole in a bank in its simplest form.
This is not rocket science. We(mankind) has been doing this for a very very long time.
You are likely scaring a lot of folks with this comment. Just go buy so Ruth Stout books or peruse old Mother Earth News. Its not that hard.
This says it all. You just saved me a long comment. People on TOD tend to way overcomplicate things.
SS must be wondering what the hell this has to do with water and oil mix in KSA oilfields! But I see this food issue as one of the most critical effects of peak oil, especially if you live in a country like UK which imports much of its food, and where people are used to buying any fresh fruit or vegetable in any month. Look at articles on how Cuba coped with cut off of its oil supply and you will see that most are about food.
Also, like many things to do with peak oil and localisation, knowledge that may be vital in the future is being lost as the people who practiced home food growing and other manual crafts, grow old without passing the knowledge to a younger generation who don't seem interested. As many above have said, it takes time to learn these things so start now while possible failure only means a few extra trips to WalMart, rather than a hungry winter.
Also, a side effect in Cuba was that with so much physical outdoor work and eating more fresh veg, people got fitter and healthier and had less need for high-tech health care.
Hi doctorbob,
re: "SS must be wondering..."
My guess is Stuart understands a little about shock (hands over eyes, peeking through fingers)...
Poor SS - maybe we wil create "future" oil in our backyards. I'm not trying to scare people it just trying to train people to grow plants that do not have experience has been eye opening(!)
I think that we may tend to forget how much we know until you try and teach someone else who doesn't have years of garden/farming history. Whether we like it or not we are looking to be training the "nentendo generation" not the summer field labor that my generation was.
I think it is all to easy to think everyone has had similiar experiences. I suspect that the percentage of people with gardening experience is many times smaller that it was 30 yrs ago. If the comments I get from retail garden centers are any indication of plant knowledge there is going to be a big learning curve. Seriously asked questions -"Do I have to water this"? This climbing rose blooms on old wood- "Well my fence is new how long do I have to wait"? The leaves on my trees all fell off whats wrong with them (ITS WINTER? maybe??) Must have come from so calif.
IMHO You will be very popular if you know alot about gardening.
While I don't disagree with ELP, I think it won't suffice. There has to be a political response to all this. That "no man is an island" was never truer than today. A hostile government will defeat all efforts at individual or even group suvival no matter how rational on their own terms. We do not have a gov't that is interested in the survival of its citizens -- to put as diplomatically as possible. So long as politics is the province of big money we are totally screwed.
Isent big money ultimately a fairly large number of people who uses, controls and works with the wealth? They ought to want to live in a functioning society.
Like Krupp under Hitler?
Hi Magnus,
I appreciate your point here
re: "They ought to want to live in a functioning society."
A proposal - let's assume "they" do - (since "we" do) - and go from there.
That is indeed my assumption. And I try to figure out how to get things to become better or at least less worse if times get tough.
Like my friend the Chimp says, move. The US government is not the one you want to have to face when this stuff starts to happen...best to be somewhere else.
WT I value your contributions here a great deal, although I have just recently gotten a UN resolution passed which bans all references by yourself and other interested parties to HL for the next four weeks ;)
That said, I need to call you on this quote. It is pretty darn dramatic to say oil exports from the major countries declined nearly one tenth last year. First off what are the assumptions you are making and secondly, put simply, where did we get the oil we burned last year? Maybe I am missing something basic here, that's fine, however, there was not to my knowledge a decrease in oil consumption worldwide. There was, if I am correct, a very slight decline in oil consumption in the US in 2006 versus 2005. I don't have figures but I wonder whether there was a net decline in oil consumption by oil importing countries as a whole 2006 vs. 2005. I realize you are looking at a month vs. month comparison so the total average decline year over year might be on the order of 4% but are you saying all of this decline has so far been made up by drawing down stocks in oil importing countries? That, at first glance, seems a pretty dramatic drawdown, and if that isn't the case, well, at some point consumption has to jibe with oil available for export, correct?
I think the key is the "top 10". There are still quite a few exporters. Also, many of the poorer countries saw major demand destruction due to cost, so that makes up for some of our demand.
See my posts on Nepal it looks like Nepal is going to self destruct because of oil rght now. Expect Bangledesh then wealthier countries like India. Peak Oil or the effects of it are like a rapidly spreading cancer by the time we see it in the US it will be too late to save the patient.
If prices get worse this year expect millions of peak oil refugees to leave Nepal within the next two years. Most would be headed for India which will have its own problems.
Also Pakistan will probably destabalize as oil prices put pressure on its economy. The intrinisic problem is fuel shortages and the resulting high prices can rapidly take out a economy and destabalize a region.
I think you will see the effects a lot faster then most people think.
Ckupp and Memmel,
I can't find good figures on total exports. However, from previous discussion:
http://www.theoildrum.com/story/2006/10/5/215316/408
http://www.energybulletin.net/22213.html
http://i-r-squared.blogspot.com/2006/12/debate-on-oil-exports-part-ii.html
I think one can conservatively assume the top ten exporters account for at least 70% of exports. So if in total they declined 8% last year we would need about a 20% increase from non top ten producing nations to maintain exports if there were no increase in demand (which there was).
Nepal's oil consumption is less than 1/40th of the United States. Moreover, the major oil consuming nations (US, EU, Japan, China, Russia, India) are fairly transparent in their oil consumption data and to my knowledge none are reporting serious demand destruction. Rather some are increasing consumption and/or putting oil into strategic stockpiles.
So if exports did not significantly increase 12/05-12/06 and there was not significant demand destruction where did the oil come from? The only explanation I can see is a draw down in stocks. I am not familiar enough in this area to guess if this is possible.
I happen to agree with WT, SS and others outside this board that we have likely seen peak oil but my guess is WT jumped the gun on saying we have seen an 8% decline in exports 12/05-12-06. If that happened, just commonsensically, I'd think we would be in a world of hurt.
Nepal drew down their stock if you read the stories.
And borrowed a lot of money they cannot repay. If you google you will find India itself is having problems most blamed on demand few are looking into supply.
It takes time for the vast web required to move oil to deplete. Its not one tanker load missed its two in a row.
Its like the little game that makes words or a picture where one of the tiles is missing. Most people are sliding the tiles around every now and then the come across the empty spot but are able to slide a new tile in place.
With Stuarts post its possible to look at articles from around the world and know that we have a tile missing.
Here is a NG block sliding
http://www.atimes.com/atimes/South_Asia/IC24Df01.html
and here
http://www.france24.com/france24Public/en/administration/afp-news.html?i...
Obviously some will succeed and some will fail.
We need to start noting the failures.
Assumptions: (1) 2005 to 2006 increase in consumption by the Top 10 was the same as 2004 to 2005; (2) Crude + Condensate = About 85% of Total Liquids.
I then compared the 12/06 EIA production numbers by the top 10 to the 12/05 production numbers (C+C). Based on the above assumptions, net oil exports by the top 10 fell by 8%. Note that this is month to month. Average year over year would be lower, probably around 3% to 4%. Note that some smaller exporters are showing increasing exports.
IMO, forced conservation is moving from poorer regions like Africa to richer regions like the US, China and the EU. Just look at gasoline prices on your local street corner. Welcome to forced conservation. It's just moving up the food chain.
If you just do some back of the napkin math a 4% loss of oil imports to a 100% oil dependent country would be 365*.04 = about 14 days supply. This number would be less depending on the amount of indigenous production, as long as indigenous production is not dropping as fast as imports. So for the US you would have 14*.75 or about 10 or 11 days lost oil supply without a drop in domestic production.
Perhaps this amount could be made up by demand destruction in poorer areas. What is disturbing is that if the US market is not getting the signal that there are 8% less exports than last year due to stock drawdowns/demand destruction in other areas and in the mistaken belief that production is not constrained, when stocks become low and demand destruction is no longer another part of the world's concern we are not facing a 2% shortfall we are facing a 10 or 15% shortfall. That could be some "Hello Dolly" for the markets.
Put another way, if SA is lying and what they should have said for the past say 6 months is we are producing flat out as much as we can we can't give you more supply, oil would likely be over $100/barrel. If stocks are being drawn down while believing production can be increased in future, we will be further along the downslope of depletion when the fact that production can't increase can no longer be denied.
As I easily tend towards more dramatic, pessimistic scenarios perhaps one might also more optimistically argue that the C+C that you looked at is also becoming a less significant component of total liquids as various alternatives are being developed. Or that the market is right and we are not supply constrained at this time.
On a completely unrelated note I stumbled on some of Mahatma Ghandis views on issues perhaps not unrelated to those discussed here at TOD
http://www.tinytechindia.com/oil.htm
I found it interesting, he sounded a heck of a lot like those wide eyed, long haired, sandle toe types I've seen a lot of here. Seriously, I was just astonished how he cut through things and defined some 80 years ago the issues such as greed, lack of local autonomy, violence, and exploitation of the poor as the issues which we are facing again now.
Cheers,
PDM
My simple Export Land Model:
http://static.flickr.com/97/240076673_494160e1a0_o.png
5% Annual decline rate + 2.5% annual increase in consumption = 50% drop in exports in 4.5 years, from 1.0 mbpd to 500,00 bpd.
Note that the UK went from exporting one mbpd in 1999 (presumably peak exports) to net importer status in 2005, so they probably crossed the zero net export line in about five years.
In the exporting countries, I think that we will see two phases:
Phase One: Rising cash flow from export sales, even as exports fall, because of rising oil prices.
Phase Two: Falling cash flow from export sales, as exports continue to fall, because rising oil prices can't offset the export decline. At this point, the countries have to decide between meeting domestic demand versus export demand, thus the prospect of poor Mexicans having to reduce their oil consumption in order to continue oil exports to the US.
I don't want to read overly much into one data point but here is a rather disturbing coincidence
"U.S. Oil Supply Drops by 900,000 Barrels Last Week; U.S. Inventories 4 Percent Below Last Year"
http://biz.yahoo.com/ap/070328/oil_inventory_report.html?.v=1
Hello P,
re: "If stocks are being drawn down while believing production can be increased in future, we will be further along the downslope of depletion when the fact that production can't increase can no longer be denied."
I just thought I'd make note of this sentence.
Hey Aniya,
Thanks. As someone with absolutely no work or academic experience in this area I can sure spin a good yarm. Let's hope it ain't true.
PDM
"So, again, are we (TOD) gonna spend another day debating this and that of what is wrong or right above, or do we want to discuss some larger points."
I think proponents of PO are faced with a version of the chicken/egg problem: Without good information, it is hard to persuade people there will be a crisis. Unfortunately, it will probably take the crisis to generate good information. Helping improve current information is why these articles and debates are important, though I think that a bit too much vitrol is spent between people who are basically on the same side.
In an effort to have more ways of informing people about Peak Oil, I put together an "Oil Quiz", together with answers. I have also included some questions for discussion at the end, if teachers want to use it in a high school or college class.
A link is
http://gailtheactuary.wordpress.com/
This is the first time I have mentioned the Quiz in a public forum. I would be interested in people's feedback.
This is very good.
The economist in me wants to argue with 6 - the export land question - I think this is true in the short term, but over the long term I am not sure that governments can maintain this in the face of loss of cash flow. I expect they will for military etc - but not for everyone. - Still I think your answer is the correct one for the short answer.
I am also more optimisitic about question 8, but don't have good answers to your very good points. My answer is something like given a choice between solving these problems and TEOTWAWKI we will solve these problems, but of course that is only a 2% decline. Faster declines I am not sure about.
Despite my nickpicks, It is excellent.
I nominate this for some kind of semi-permanent link at the top of TOD. Irrespective of any very small nitpicks that might be addressed in that process, it seems like a good tutorial summary/introduction to me. Oh, and it's very refreshing indeed to get a clear picture without having to cope with a certain sort of combative testosterone-induced eschatological hysteria that's become all too common in the comments around here.
Okay, I'll go take some extra estrogen to balance out that alpha female piece...:-)
Most of the questions are true/ false; questions 4 and 12 are multiple choice. The answers I provide are one or more paragraphs, with graphs.
The items are
.
The link again is http://gailtheactuary.wordpress.com/
Perhaps use Dick Cheney's own figures? [1999 London speech]:
...Exxon-Mobil will have to secure over a billion and a half barrels of new oil equivalent reserves every year just to replace existing production. It’s like making 100 per cent interest discovery in another major field of some 500,000,000 barrels equivalent every 4 months or finding 2 Hibernias a year.
...finding and developing enough oil to offset our 71 million plus [[now abt 84]] barrel a day of oil depletion, but also to meet new demand. By some estimates there will be an average of 2% annual growth in global oil demand over the years ahead along with conservatively a 3% natural decline in production from existing reserves. That means by 2010 we will need on the order of an additional 50 barrels a day. So where is the oil going to come from?
...Governments and the national oil companies are obviously controlling about 90% of the assets. Oil remains fundamentally a government business. While many regions of the world offer great oil opportunities, the Middle East with two thirds of the world’s oil and the lowest cost, is still where the prize ultimately lies.
...Oil is unique in that it is so strategic in nature.
...The degree of government involvement also makes oil a unique commodity .
...It is the basic, fundamental building block of the world’s economy. It is unlike any other commodity.
Awesome! :o)
Agreed.
Gail, this link is going directly to my blackboard site at the University of Southern Maine.
thank you.
This is a really excellent quiz. Way to go!
Kibbitzing :-)
How about if for No. 6, instead of true/false, the choices were
* less than 5%
* 5%
* more than 5%
. duplicate
Hi Gail,
A few comments. I know if I sent this to family they would probably make it through the questions, but when they reached the answers their eyes would glaze over at the long comments. Maybe as a web document you could put the answers with a short one sentence explanation and then have a link to the longer explanation. Or one link that expands the answer section. I could see this format working as a class handout though.
Best,
Mark
Gail,
This is really good and its clear you spent some time putting it together. My only issue is with question 10. The other questions are really more easily verifiable. But as regards question 10 who knows what the first five years of an oil shortage will look like, what the "necessary changes" may be and what can happen in five years. One can quote various predictive experts but really who knows. Otherwise I think this is quite impressive.
How about this version of #10: Once it is clear that oil production will start to decline, we will be able to make any necessary adjustments. It will just work itself out. (Agree/Disagree)
The answer to your question is "true" because it literally will work itself out... just not in the fashion that most of us would like. Thus I do not find your suggestion compelling.
I am not sure what to suggest but I do like Gail's better at the moment.
Ghawar Is Dying
The greatest shortcoming of the human race is our inability to understand the exponential function. - Dr. Albert Bartlett
.
.
That is great. Top notch work. Best of all it can serve to get people thinking.
Wow, that's just a fascinating article. Thank you.
You know the most persuasive argument sometimes is just presenting folks with evidence... and NOT making an argument.
I've been following the issue for a while now and I still don't know (and neither do you) whether we're in for mere recession and economic turbulence accompanied by gradual readjustment to a new paradigm.... or civilizational collapse.
Efforts at prophecy are useless. But facts and factually based analysis like this can open people's eyes. This article is just the kind of brick in that wall that is needed.
The great mass of people will think something is up when they feel the effects in their pocketbooks, and not a minute before.
Until then we can scream and yell to our heart's content about the peak oil "issue", and it will make not a bit of difference.
Just hang out, enjoy the ride, and find what satisfaction you can in knowing that you saw something big coming a few minutes before most folks did.
Stuart, excellent work, as usual. Clear, concise and detailed. I too think that Fractional Flow has been trying to steer us in the right direction, whilst doing his best to cover his tracks. Anyway, it appears we're going to find out one way or another relatively quickly. It's impossible to believe that Cheney and the Pentagon don't have access to this kind of information. The national security implications of this kind of data are substantial. It would be interesting if someone like FF in the US military could turn up and give a few hints too!
Fractional_Flow might very well come to be the Deep Throat of PO....(follow the Sw!, follow the Sw)
I have noticed a number of oil-field savvy folks have popped by lately (past 2 weeks or so) and dropped some very provocative posts.
Until recently I have been on the fence, weighing the merits of the two camps that frequent TOD, i.e. Peak is now vs. not-yet but soon, the evidence and analysis that has recently come out is astounding in its scope and implications.
Thanks to all replies to my top statement. That was great to see, and what i was looking for. A nice thread. Thanks for your contribution!
I got the hint about the farming/garden stuff, and I am into at least my second growing season (potatoes, tomatoes, some cabbage (got the last broccoli in december ! last year). I *could* 2008 move to the countryside (Europe). That seems like a general recommendation. Mum grew 80x20 m potatoes for our family every year when I was a kid.
Thanks for the comments about presenting facts if someone asks, that works better than arguing, convincing and propehtizing. You are correct. It doesnt work to push the theme, I have "worked" on my brother for about 3 years to understand ecology and the concept of sustainability, and it just starts to bite. Lately I have added peak oil as the whip to get us there (with a vengeance, sadly, perhaps).
The quiz I sent to my friends, as it also plays with the "can you figure this ones out?" competition. I should get some questions back. Great. And ofcourse the "peak oil credo" from this weekend.
Dont forget to use the PhD thesis (readable) from Sweden at
http://www.diva-portal.org/diva/getDocument?urn_nbn_se_uu_diva-7625-1__f...
for facts especially the section on hubbert method was clear and shows how ans when it is used (I thought). 3 Mb.
Take care out there!
Most people will react when they pay more for fossil fuels. Only a very small part of any population is able to act on independently-arrived conclusions. Maybe a good thing, too, since many such conclusions, probably most, are wrong.
People will believe the most ridiculous nonsense, however, when they feel the price action supports the story, as the price is taken as a "consensus." The best example is the late 1970s, which were a time of cheap and plentiful oil (just look at the production rise) but price rises due to monetary inflation ie a depreciating dollar. When the Fed took its foot off the gas pedal in the early 1980s the entire oil industry found out how cheap and plentiful the oil really was.
The market for crude oil is not very efficient and is easily manipulated. There is a lot of inventory out there -- the US's SPR alone can deliver 3mb/d for 200 days -- and changing the futures price is peanuts.
Lastly, I would say that there is good reason for a "lets all become farmers" approach but Peak Oil is not it for at least a few years.
Stuart,
Excellent work, as usual.
A simple way to explain oil/water phases is that in most cases, the reservoir permeability relative to water is higher than the permeability relative to oil. So, as you noted, when the water hits, it tends to hit hard.
Where we have a thinning oil column with a strong water drive and/or water flood in the water column, I have seen some examples of leases producing 100% oil on January 1st and 99% water on December, 31st of the same year, as the advancing oil/water contact moved updip across the lease.
As I have described several times, the current fate of the East Texas Field--1.2 mbpd of water per day with a 1% oil cut--is the fate in store for all of the world's large water drive fields. For example, Prudhoe Bay has a 75% water cut, Daqing, a 90% water cut.
As I have also noted several times, in Texas, after the peak, we saw:
Higher Oil Price + Record Rig Counts = Lower Crude Oil Production
We can and are finding new fields in regions that have peaked, but we can't offset the declines from the old, large fields, and it's a near certainty that 14 out of 14 of the fields that are or were producing one mbpd or more are now in decline or crashing.
Meanwhile, to put our current consumption in perspective, worldwide we used, during the first term of the Bush administration, about 10% of all the crude oil that has ever been consumed. Based on Deffeyes' HL plot, during the second Bush term we will use about 10% of all remaining conventional crude oil reserves.
Geology aside, a sharp concentration breakthrough is typical of the way packed beds operate up here on the surface. You do not get a linear rise over time, but almost always a sudden jump to the inlet concentration.
Correct because its basically a phase transition not to different from melting.
WT, did you see this article at Energy Bulletin about giant oil fields?
It goes beyond your super giant argument (the fields that produce 1mbpd and analyzes the 507 "giant" oil fields that have ever been discovered. Giant is defined as a field with 500 million barrels total or larger. In 2005, an amazing 60% of all oil produced came from the less than 1% of fields that are classes as "giant" fields. And almost all of the giants are declining. And worse, over 65% of all known reserves occur in giants, not in the nickel and dime fields that we saw argued by some cornucopians.
The doctoral thesis goes further and states that best case - global peak is 2018 and worst case is global peak in 2008. This is a separate analysis that does not use Hubbert's methods, Hubbert Linearization, or other traditional techniques (megaprojects, etc.).
You can download the PDF of the full dissertation here. I highly recommend reading it. It provides yet another piece of the overall puzzle.
I would also note the following:
1. Hirsch stated that the US needs at least 20 years minimum to meet the onset of peak oil without serious repercussions.
2. The majority of the reality based assessments for peak oil put peak between 2005 and 2018 at the latest.
3. Thus we have between -2 and +11 years left to do anything about it.
If you believe Hirsch's assessment, this means the US (indeed most of the world) is screwed and there is nothing that anyone can do about it.
People who claim that the proactive stance is simply hyperbole must first answer Hirsch's report. And no, I will not accept a little bit of hand waving and promises that the market will solve everything. There is minor disagreement between Stuart, Euan, Westexas, Robert, and others about the exact peak. But all of them put the peak close enough that, if Hirsch's report is true, then the entire world is in big trouble.
Ghawar Is Dying
The greatest shortcoming of the human race is our inability to understand the exponential function. - Dr. Albert Bartlett
This seems interesting, i suspect that it should be possible to use the size of the largest fields to do a rough estimate of the reserves.
GZ,
Hirsch's report was supply-side only. He didn't address such things as electrification of transportation.
Do you really expect an entire nation predicated upon the automobile can convert to electrified transportation and ramp up the ensuing infrastructure in less than 20 years? How about 11 years? That's the best estimate of what time we have left. Or how about we're already 2 years too late? That's the worst estimate.
Further, have you actually read Hirsch's report or are you trying to minimize it without regards for what it actually says? Beginning on page 20 he discusses the very capital intensive nature of oil related equipment throughout the North American economy. He notes, for instance, that consumers will spend $1.3 trillion US dollars (constant 2003 dollars) over the next 15 years and still replace less than half of the existing automotive stock.
Half of the existing light trucks will be replaced over the next 14 years at a cost of $1 trillion dollars. And less than half the heavy trucks will be replaced at a cost of $1.5 trillion dollars over the next 20 years. Airlines will replace less than 50% of their existing stock over the next 20 years at a cost of $250 billion.
When analyzing that set of capital stock alone, Hirsch concluded:
Now obviously, a key factor in rate of replacement is rate of decline of oil production. If the decline is slow and steady, then capital intensive areas can be replaced with a minimum of government intervention. But what if it is not? What if Ghawar is about to do a Yibal? What if Ghawar is about to do a Cantarell? What if the bulk of OPEC stands on the verge of precipitous and rapid declines?
And of course, Hirsch did not even attempt to account for Westexas export-land model where increasing domestic consumption trumps exports.
And if we jump to electrified transportation, then the most efficient such jump is to light rail. And light rail cannot serve the existing low density suburban sprawl. So as Alan Drake often notes, we have to reverse the investments of 1945 to 1975 in order to rearrange our living conditions. But we won't have 30 years this time to make several trillion dollars in housing changes. And if we don't jump to light rail, but instead depend upon electrified cars, then we are (a) still stuck with the capital changeover costs noted above and (b) stuck with dependency on an as yet unproven technology.
There are no easy answers here, Nick. And you can't discount Hirsch because of his approach. His approach made great sense given that we are an automotive culture, like it or not.
And finally, the US currently has the wonderful population growth rate of 0.91%. Amazing, eh? By 2050, you're looking at 420 million Americans at that growth rate. And no, it is not all illegal immigrants. Immigration adds about 1 million people to the US per year. The other 1.7 million are born here.
So, in the midst of this declining energy regime, we still have to build the equivalent of 1 new San Antonio every 120 days. And we'll have to find the food to feed these people because if you don't, violence will ensue.
Hirsch only barely scratched the surface of the problems facing us in a declining energy environment. The reality is likely to be a depression that will make the Great Depression look like a picnic and not end in any foreseeable future.
This is why we need the maximum lead time on peak oil. This is why mitigating early, although it may have an opportunity cost (as the economists like to say), is still worth doing. Mitigating early means my lifestyle changes but my quality of life may not. Mitigating late means my lifestyle changes anyway and goes down at the same time.
Yet in all this, after Hirsch's report, after Cheney's own public comments, after 2+ years of oil production plateau unlike any other plateau in oil patch history, we have still done NOTHING.
If you're betting on a happy ending here, Nick, don't bet too much.
Ghawar Is Dying
The greatest shortcoming of the human race is our inability to understand the exponential function. - Dr. Albert Bartlett
Very well said. This has been the gist of my argument: It's not the lack of technology--it's the scope of the problem that's going to get us. That's part of the reason why I believe our politicians have done nothing domestically to address peak oil: The problem is just too big and they waited about 20 years too long to mitigate it.
Posts like this are what make me tune in to TOD. Well said.
The US may be able to mitigate a bit by a transition to Japan or EU-level efficient vehicles first, before the more difficult electrification. That's easier known technology: small diesel engines. One thing would be to allow import of any EU-spec new vehicle with >30 mpg, no point in having minor differences in regulations between DOT and EU.
I don't know what Japan and Europe are going to do; they will just be hit less hard. Since consumers there will be more into fuel conservation to begin with, probably the bigger initial markets for plug-in hybrids may be there.
I've been a big fan of electric vehicles....Until I started thinking about heaters in Wisconsin. An IC engine has so much waste heat that adding a heater is absolutely free. An electric car would have its range demolished in a midwestern winter.
Abandon hope.
Heating a car doesn't take that much power, and it wouldn't hurt an EV's performance.
Actually, you'll be happier, because you'd get instant-on heat. With most cars, you're lucky if you get heat at all, on short trips when it's really cold.
But a successful interim transition presumes a decline rate no greater than N. What happens if the decline rate is greater than N? What value does N have anyway? No one has answered these questions. Hell, no one is even asking these questions. We're still arguing about whether peak oil will occur or not with most of the world still firmly in CERA's camp, in case you (and everyone else) forgets.
Ghawar Is Dying
The greatest shortcoming of the human race is our inability to understand the exponential function. - Dr. Albert Bartlett
Thank you. This is what I'm trying to say its time to focus on today tomorrow and six months form now. Peak oil and its effects happen NOW not yesterday.
Initially the effect the poor sure but this won't stay contained it will spread.
Simple things like sending millions of solar cookers to the third world to lessen the impact of high propane prices will have a enormous effect if we do them in a timely manner.
Hi m,
Agree w. your points here, esp. the "now" one.
Something folks may overlook - (I'm just not sure!)- is the tremendous number of people who already devote substantial time/energy/money to things like this: www.solarcookers.org,
http://www.womenforwomen.org/ and literally tens of thousands (if not hundreds of thousands) of groups like them in the US (alone).
And to...(for benefit of the nuke weapons discussion)... serious prevention efforts, eg., www.psr.org, www.idds.org, www.fas.org, www.cdi.org, etc. Emphasis on serious.
A steady decline rate N isn't what scares me. Even if N is a large number.
What frightens me are the potential resource wars. You wouldn't need a very large conflict in the Middle east (or elsewhere) to knock out a very large chuck of the world's oil supply.
A very sudden drop in the oil supply will ratchet up instability making recovery much harder.
They were able to repair the wells after Gulf war I. They have been relatively unsuccessful at fixing Iraq's production capability after Gulf War II (a very short war that spared the oil infrastructure). Could they do it after Gulf war III? IV?
Exactly. And what Stuart and FF are showing us is that it's possible that any resource grabbing endgame can be ultimately futile.
Resource wars done in relative isolation while production output potential is still robust is one thing.
Infrastructure destroying wars fought when production recovery is going in the 'tank' anyway seem orders of magnitude more problematic.
More soldiers, more dollars, more risk I would imagine.
"Do you really expect an entire nation predicated upon the automobile can convert to electrified transportation and ramp up the ensuing infrastructure in less than 20 years?"
Sure. If we really want to.
"have you actually read Hirsch's report? "
Sure. His analysis is very preliminary, filled with rough estimates for lead times. A good example is the following:
"He notes, for instance, that consumers will spend $1.3 trillion US dollars (constant 2003 dollars) over the next 15 years and still replace less than half of the existing automotive stock."
Not true. New vehicles are driven much more than older vehicles. Light vehicles with a mean age of 6 years or less account for 50% of vehicle miles. So it's not 15 years to effectively replace half your vehicles, it's 6.
Hirsch just ignored the whole question of vehicle efficiency or electrification, and looked at supply side.
Already 1.8% of new vehicles in the US are partially electric. That % could rise very quickly, and Toyota type hybrids can be retrofitted.
GM is trying to manage and lower expectations, but they know it's essential to deliver the Volt very close to the 3 year deadline they've set. The battery technology is here, though the battery pack technology hasn't been fully designed.
I agree that we're doing far too little, and that there is likely to be a great deal of unnecessary pain. But...things are happening.
I think the reference here is not to how quickly John Q. Public replaces any given vehicle he purchases with a new vehicle, but what the mean is before one of those vehicles is finally junked and off the roads.
Yes, that's what I was addressing.
The important thing isn't when the vehicle is junked, it's how much it's used. Lots of older cars get very little use.
Your number contradicts multiple sources I have seen. What is the source for your claim?
Ghawar Is Dying
The greatest shortcoming of the human race is our inability to understand the exponential function. - Dr. Albert Bartlett
vehicle sales of 16.9M in 2004.
http://www.bts.gov/publications/national_transportation_statistics/html/...
Passenger car & Other 2-axle 4-tire vehicle: 228M
http://www.bts.gov/publications/national_transportation_statistics/html/...
Average Lifespan: 13.5 years, by dividing fleet size by sales volume. Median age can be expected to be slightly less than 13.5 divided by 2, as sales are rising). Note: average age may be higher than the median, as a few vehicles are kept for a very long time. So,
Median vehicle age: less than 6.8 years.
Now, here’s the direct data: http://www.bts.gov/publications/national_transportation_statistics/html/...
we can see that in 2005 median age was
Cars: 9.0 years,
Light trucks: 6.6 years.
Suggesting an overal median somewhere around 8 years. As we can see, there’s some disagreement in the data, but the median is somewhere around 6.5-8 years. The center of that range is 7.25 years.
That means that half of all vehicles are replaced in very roughly 7.25 years.
Now, from a household survey (a little less reliable, where data conflict I use BTS data) we see that many households have multiple vehicles, some of which are driven more than others.:
http://nhts.ornl.gov/2001/presentations/vehicleMiles/index.shtml
Now, look at this page, slide 13: http://nhts.ornl.gov/2001/presentations/americanVehicles/index.shtml
We see that vehicles aged 1-5 are driven 13k miles/year, while 6-8 get 12K, and over 8 get much less.
This source says the difference is even more pronounced: http://www.eia.doe.gov/emeu/rtecs/chapter3.html
This source gives us actual vehicle miles traveled (VMT) by age of vehicle. http://npts.ornl.gov/npts/1995/Doc/table8.pdf
We see that vehicles 6 years of age or less handle 49.2% of all VMT.
Now, if gas prices were to suddenly double, you can expect that 1) households with multiple vehicles would shift their VMT to the most efficient vehicles, 2) vehicles would transfer between households to maximize use of efficient vehicles, and 3) those with less efficient vehicles would be likely to speed up their turnover. The % of miles travelled by newer and/or most efficent vehicles would probably rise dramatically, and the figure of 6 years (for 50% of VMT) would be likely to shift to 4 or 5 years.
You are confusing median age of the vehicles with median replacement time or "scrappage" time/rate. The two things are not the same nor are they directly comparable.
See Heavy Truck Scrappage And Survival Rates (WARNING! Excel file!) as published by Oak Ridge National Laboratory for one example. Oak Ridge has others for light trucks and cars as well.
Ghawar Is Dying
The greatest shortcoming of the human race is our inability to understand the exponential function. - Dr. Albert Bartlett
"You are confusing median age of the vehicles with median replacement time or "scrappage" time/rate. The two things are not the same nor are they directly comparable."
Well, the first calculation was intended to give people a sense of context. I agree, with rising sales the fleet/sales calculation gives a number that's a little too low. OTOH, the following data presented actual median age. The two things aren't identical, but they're closely related: the calculated number, and the kind of table you pointed me to is how the actual median age would look over the long-term, if sales were stable. So, perhaps the 7.5 to 8 year figure is better.
And, I agree that heavy commercial trucks, like airplanes, tend to stay in service much longer than passenger vehicles, but that wasn't what I was talking about.
Oak Ridge data is perfectly consistent with the data I cited (actually, most of it WAS Oak Ridge data). See table 3.6, rightmost column, in
http://cta.ornl.gov/cta/Publications/Reports/TEDB_Edition24_ORNL_6973.pdf
What do you think of my basic point, that 50% of light vehicle VMT is driven with vehicles 6 years of age or younger?
I'll agree with that point but let me spin it back at you - 50% of all light VMT are in vehicles older than 6 years.
And yes, as the number of vehicles in service rises, the median age tends towards the leading edge of that process while the vehicle scrappage rate is fairly constant.
What you are suggesting is (it appears to me) that Hirsch erred in his interpretation of the data, apparently confusing the scrappage numbers versus the median age? That's an interesting thought and your initial data seems to back it up. That gives us a bit more breathing room but still not much. And that assumes a gentle enough decline that we can move to higher fuel efficiency vehicles while we unwind the great suburban experiment.
Table 3.6 does point out an interesting oddity, just because of how they categorize their data - there are almost as many vehicles more than 15 years old as their are new to 2 years old.
By the way, look at table 3-4 and see the total number of automobile new sales. That number is almost half of what you reported via bts.gov. There appears to be some difference in what is being reported between bts.gov and ornl.gov. I am not going to suggest that either one is wrong though that might be the case. I suspect rather that each is actually measuring something other than what we may initially suspect.
It would be interesting to see Hirsch's explanation for those numbers as well as an explanation from someone more familiar with exactly what was being measured in each document.
I should try to find Stuart's article on VMT and vehicle replacement rates. I am pretty sure he did one here sometime in the last 2 years. He might have comments that would clarify the situation.
Ghawar Is Dying
The greatest shortcoming of the human race is our inability to understand the exponential function. - Dr. Albert Bartlett
"What you are suggesting is (it appears to me) that Hirsch erred in his interpretation of the data, apparently confusing the scrappage numbers versus the median age?"
That's what it looks like. A similar thing for people would be confusing the average age of death (about 78) with the average age of the population (about 35).
Also, he would need to include the effect of declining miles per vehicle with age, which reduces the median VMT point (and gasoline consumption) from around 7.5 years to 6 years.
"look at table 3-4 and see the total number of automobile new sales. That number is almost half of what you reported via bts.gov. "
I believe what you are seeing is the difference between "cars" and "light vehicles", which includes SUV's, pickups, and other small trucks. I used "light vehicles", which is the more common measure of private passenger vehicles.
I hate to criticize, but these Hirsch report vehicle replacement errors are really major mistakes. Also, the CTL analysis, IIRC, used estimates for maximum construction rate that seemed to be pulled out of a hat. This is a publication that a lot of people are relying on, and it seems to have been put together with very little real data, or careful analysis. I can accept that this is intended to be a very preliminary effort (though I don't think it was presented that way, nor do I think people are using it that way) but the scrappage error wouldn't be acceptable in a high school term paper.
To those who have not been following the discussion since 2005:
The original Hirsch, Bezdek & Wending paper (2005):
PEAKING OF WORLD OIL PRODUCTION: IMPACTS, MITIGATION, & RISK MANAGEMENT
http://www.pppl.gov/publications/pics/Oil_Peaking_1205.pdf
A later paper by the same authors (May, 2006)
ECONOMIC IMPACTS OF LIQUID FUEL MITIGATION OPTIONS
http://www.netl.doe.gov/energy-analyses/pubs/Economic%20Impacts%20of%20U...
And for busy people a summary slide set by Hirsch (October, 2006):
Peaking of World Oil Production: The Mitigation Challenge
http://www7.nationalacademies.org/bees/Bob_Hirsch_Mitigation_Challenge.pdf
I'd also recommend Hirsch ASPO 2006 slide set:
Mitigation of Peak Oil: Making the Case, More Numbers, & Some Questions
http://www.oilposter.org/blog/hirschslides.htm
and Bezdek's ASPO USA 2006 slide set:
ECONOMIC IMPLICATIONS OF LIQUID FUEL MITIGATION OPTIONS IN THE USA
http://www.aspo-usa.com/fall2006/presentations/pdf/Bezdek_R_Boston_2006.pdf
Hirsch got quite confused about vehicles:
"Automobiles represent the largest single oil-consuming capital stock in the U.S. 130 million autos consume 4.9 MM bpd, or 25 percent of total consumption, as shown in Table III-2. Autos remain in the U.S. transportation fleet, or rolling stock, for a long time. While the financial-based current-cost, average age of autos is only 3.4 years, the average age of the stock is currently nine years. Recent studies show that one half of the1990-model year cars will remain on the road 17 years later in 2007. At normal replacement rates, consumers will spend an estimated $1.3 trillion (constant 2003 dollars) over the next 10-15 years just to replace one-half the stock of automobiles. (at 8.5mm purchases/yr.)
A similar situation exists with light trucks (vans, pick-ups, and SUVs), which consume 3.6 MM bpd of oil, accounting for 18 percent of total oil consumption. Light trucks are depreciated on a faster schedule, and their financial-based current-cost average age is 2.9 years. However, the average physical age of the rolling stock is seven years, and the median lifetime of light trucks is 16 years. At current replacement rates, one-half of the 80-million light trucks will be replaced in the next 9-14 years at a cost of $1 trillion. (also at 8.5mm purchases/yr.)
Seven million heavy trucks (including buses, highway trucks, and off-highway trucks) represent the third largest consumer of oil at 3.0 MM bpd, 16 percent of total consumption. The current-cost average age of heavy trucks is 5.0 years, but the median lifetime of this equipment is 28 years. The disparity in the average age and the median lifetime estimates indicate that a significant number of vehicles are 40-60 years old. At normal replacement levels, one-half of the heavy truck stock will be replaced by businesses in the next 15-20 years at a cost of $1.5 trillion." (at 0.5mm purchases/yr.)
Source: "Peaking of World Oil Production: Impacts, mitigation, and Risk Management," Hirsch, Bezdek, and Wendling 2005. (table and footenote omitted.)"
Now, generally speaking the median and the average are very closely related. If the distribution is a little odd it can vary. Say there's a long tail of very old trucks: that would make the average age a bit higher than the median. If there were a sudden recent surge in sales, then the average would be a bit lower than the median, until the "hump" in the distribution worked it's way through to the median.
So, when Hirsch says the average is 7, and the median is 16, that makes no sense unless there were an enormous spike in sales for the last few years (say, 3 times normal), which was not the case.
Similarly, Hirsch says that an average age lower than the median for heavy trucks suggests an excess of very old trucks. He appears to have it exactly reversed: a lower average suggests the distribution is skewed against older trucks which would weight the average more heavily than the median.
We saw above that his conclusions about vehicle replacement were entirely wrong, and now we begin to see why: his analysis was quite confused.
Westexas,
Is there are reference that you could provide for DaQing at 90% water cut?
Cheers
Water Management in North Ain Dar
The link given above is a $20 purchase. It is avaliable free on the web at:
http://freeoil.1111mb.com/spe/spe93439.pdf
The paper explains in great detail exactly how they are managing the water. They are plugging some wells above the high water areas (Rigless Water Shutoff) and on other wells they have drilled a "Short Radius Horizontal Sidetrack" in the top ten feet of the reservoir.
In other words they are simply taking oil from the very top of the reservoir to avoid the water below. These works after a fashion but remember the reservoir is an anticline and therefore does not have a flat top. It resembles a mountain ridge below the surface. Therefore by taking oil form only the very top of the reservoir the wells will tend to water out around the edge of the reservoir first because they are further down the side of the anticline.
As one might guess, oil production from any well that was plugged near the top of the reservoir would produce a lot less water but also less oil as well. This can be seen in the drop of oil production form North Ain Dar from over 600,000 barrels per day prior to 1998 to about 500,000 barrels per day thereafter. But since we only have data through 2004, in this paper, it may have dropped quite a bit more in the last three years.
Ron Patterson
That's going to take a while to digest. Thanks for all the hard work, Stuart (by the way, your graphs make good TV visuals).
This is as good a place as any to drop a link to a short article on my web site entitled Peak Oil, Missing Oil Meters and an Inactive Pipeline: The Real Reason for the Invasion of Iraq?
It's based on posts late last week by Cid Yama and Samsara, and fleshes out the possibility that Iraqi was invaded mainly to mask the Saudi production decline.
Why be subtle? - Iraq was invaded to get the oil, period. As seen by the British now actually having to confront the fact that the oil bonanza is over in their backyard - Blair was hoping to mask that as well. And let's not forget the Dutch, of Royal Dutch Shell fame, who also face declining fossil fuel production (natural gas in their case).
The resource wars have begun, with the oil multi triumvirate having stumbled badly at the start - as Cassius learned, having a lean and hungry look is not an advantage when jockeying for the prize.
If (and this is a gigantic IF) the US and Britain actually went to war to cover up the theft of 1.6 mbpd of Iraqi oil (diverted through Saudi pipelines as suggested yesterday by some conspiracy buffs), then have they really "failed" at all?
Note that I do not buy that theory at all. I wouldn't buy that theory with someone else's money. But if you are going to argue that this is what they did, then how can you argue that they've failed? By your argument they have succeeded spectacularly - nearly 2mbpd guaranteed to the west for several consecutive years at a cost of a few thousand US/British troop deaths.
And further, Blair has succeeded in avoiding the problem on "his watch" while Bush has nearly succeeded while avoiding the problem on "his watch" as well. Both of them are going to hand off their current list of problems to their successor (which is what their predecessors did to them).
If you're going to believe the conspiracy theories then you have to admit that they've been damned effective at what they are doing. Me? I prefer to believe that they are stumbling around in the dark because they can't think out of the box. Which of us is right? Probably neither as they are likely somewhere between total klutzes and evil masterminds.
Ghawar Is Dying
The greatest shortcoming of the human race is our inability to understand the exponential function. - Dr. Albert Bartlett
Possible new energy concept: ORODSI, Oil Return On Dead Soldier Invested.
Excellent metric, but only if we assume that those sending the soldiers place a non-zero value on their lives.
Or a bumber sticker I made and generously donated to the exteriors of appropriate vehicular behemoths:
How many miles per soldier does your SUV get?
-PoP, agitator
PoP, rock on! My "free bumper sticker for the deserving" is more blunt:
GIs DIE SO I CAN
GUZZLE GAS !
I keep 'em in my car along with a rag to clean their bumper so they get the *maximum utility* from the sticker. I actually put one on a hummer while Rambo sat in a parking lot idling to run the AC ! I'll admit it's still pretty lame considering how grave our situation is, but it's what this subversive can do.
You freakin' doin' good man! I lllllike that.
After the Iraqi oil contracts were initially signed about a month ago, during the "surge" stuff, at a press conference Cheney said something to the effect that the war had been a "resounding success." As I recall reading, the journalists present at the time reacted as if he was delusional.
And Bush continues to cling to the idea that history will prove he was/is an American hero and we'll all see, in that rear-view mirror, that the war was the right thing to do for America.
Then we have the secret energy meetings early in the administration's tenure. The only info released so far were maps of Iraqi oil fields, maps of Iraqi oil infrastructure and companies involved, and names of some of the attendees (which included CEO's/COB's of some of our top multi-national corporations--not just oil CEO's).
Then we have the morphing reasons for the war. As each one is debunked, we get a new one. Leaving Iraq? Hell no. We now have 14 permanent bases and talk of leaving is nothing more than subterfuge.
Without moralizing or getting into details regarding my overall disdain of our politicians and what I see as a total lack of leadership, if one steps back and looks at the whole situation unemotionally, there is really only one conclusion you can come to: OIL.
There is nothing more critical to the US economy than cheap, plentiful energy. There is nothing more important to empire than cheap, plentiful energy. It affects everything around us from the food we eat to the pills we take to the clothes we wear and the places we live. Why would anyone not believe that the elites that run our country would go to almost any extreme to keep it all rolling along?
Ckaupp: You make good points but you also make the common assumption that the "elites" are overly obsessed with the "American economy" and the "empire". There are no facts to substantiate this claim. The Iraqi oil laws were not written to advance the "American economy", they are written to advance specific interests. Haliburton to Dubai, Citigroup cutting NA jobs while hiring in India- the headlines roll by every day but no one notices while continually the claims are made that the "elites" are trying to build the "American economy".I wouldn't hold my breath waiting for the "elites" to focus on America. They don't have time-they are very busy making money.
I agree completely...I guess I didn't go far enough before. Up until today, I was a moderate doomer. I may have just moved over to the extreme doomer side.
The only part of the American economy that the elites care about is protecting themselves. By trying to make it appear that the American economy is okay, or that we are just in a mild recession and better times are just around the corner, they protect their butts. The "average" American exists in far greater numbers than the elites do and they want to keep the population from rebelling against THEM. That is all they care about besides filling their, and their cronies pockets (and I've said that numerous times).
It's about controlling the population's perceptions, and so far they've been pretty effective at it. Most folks are not aware of the great difficulties our economy is already experiencing and they are not aware that the greatest difficulty mankind has ever faced is right around the corner. If folks realized the "growth" game was/is over, what do you think would happen to the stock market, real estate, bonds, etc? What would this mass of humanity do? The elites must control that perception -- at least until they feel ready to deal with it. Are they done building the detention centers?
Personally, I think our economy has been in catabolic collapse ever since we got mired in Vietnam and couldn't pay our debts in gold (on demand) and we dropped the gold standard. No matter how good it felt at times after that, the end game was in play.
Hello BrianT,
I like this point:
"...to advance specific interests."
This is why (it seems to me) it's a mistake to see the situation we face as intractable, without looking at ways to answer the question "What if there was a way - what would it be? What is it?"
US/Bush is flanking a major supplier of oil to China, and China is on side with the UN resolution(s)...now. So, those trips to China and Asia in the last few months probably went something like this...
China we are going to screw with Iran, so you take the new (heavy) oil from Venezuela - Chavez is a pain anyway. And, Japan, not such a good idea to invest in Iranian fields at the moment. Oh, India, we keep telling you a Iranian/Indian pipeline - bad idea - go nuclear (here is some help). And, Russia do you like our new ABM sites.
Now if only political communications were so straight forward.
This needs a little touchup with Occam's razor. Bush went to war to control the oil region. Blair went along to maintain the special relationship.
As I stated previously, I do not buy this idea at all. But there are those who do, who suggest that not only Saudi Arabia but Kuwait have been involved in this theft of Iraqi oil. See the next reply below yours for an example.
My sole point was that IF you believe this sort of conspiracy stuff, then you must acknowledge that they have been fantastically successful.
Ghawar Is Dying
The greatest shortcoming of the human race is our inability to understand the exponential function. - Dr. Albert Bartlett
The detailed post referred to above is underneath this reply.
Nothing what I wrote is conspiracy oriented - Saddam claimed that Kuwait was taking oil from the Iraqi side of the shared border before his invasion, footage from Iraq War I showed just how close the oil infrastructure on both sides of the Kuwait/Iraq border was (much of it torched, but such is the fortunes and waste of war), slant drilling is not exotic technology, and the Kuwaitis felt stiffed by the lack of the full payment of Iraqi war reparations (not that anyone mentions the 137 billion dollar settlement in Kuwait's favor anymore - that is my memory anyways, without further researching).
All very public domain, including the fact that American companies were favored by a grateful autocratic Kuwaiti regime after throwing out the Iraqi occupiers. That oil prices remained low through the 1990s was also influenced by that same Kuwaiti 'gratitude' for our continuing protection with US forces against that ferocious Iraqi tyrant, though this is merely speculation on my part, based on decade+ old memories from Washington Post articles, ambassadorial statements, UN resolutions, the occasional terrorist bombing (like Bush I) or air space incident, etc.
Here is another geographic, and completely non-conspiracy oriented fact - the Iranians can pretty much completely shut down meaningful Kuwaiti exports by tanker, regardless of who owns the oil.
Welcome to the spring of 2007 - and to think in 1987, people didn't think mentioning such a simple fact was part of a 'hypothetical situation' or a 'conspiracy theory.' How quickly the decades go by.
And the Iranians, for one, remain convinced their oil is the next on our list - but then, their memories are longer than what I listed here.
And the Iranians, for one, remain convinced their oil is the next on our list - but then, their memories are longer than what I listed here.
Well said. The Iranians know that the time is up, probably this summer. They are ready though. If we are stupid enough to attack then hello WW3. The Iranians have had years to prepare for this. They will not go down without making history. Too bad, I loved driving....
I'm uncertain who you are addressing, but personally, I think Kuwait was used to disguise where a portion of the Iraqis' oil went after the invasion - after all, according to international law, the conquerors of Iraq have no right to what properly belongs to the Iraqi people (yes, yes, I know, we are all dying of laughter at the idea that the Bush League would respect any law, or feels that any meaning of the term 'accounting' applies to them).
And it would have been a case of hiding in plain sight since the beginning of the 1990s - the reconstructed Kuwaiti oil infrastructure (hmm, remind me again, who did the grateful Kuwaitis award contracts to?) plus a bit of preliminary preparation for the rig crews (slant a bit more to the left), and voila - possession is 9/10s of the law (we can likely agree that the Bush League does tend to have some respect for that cynical formulation). And oil sitting in Kuwaiti storage facilities awaiting transport on tankers loaded from Kuwaiti facilities sailing towards the good guys spreading democracy to a grateful Middle East (the Emir remains a committed supporter of democracy, doesn't he? - I mean, after we re-installed him?) is one of the happy reasons we fought the first Iraqi War, isn't it? Or was that the second one - sometimes, it all seems a blur over the last 15 years.
I don't need conspiracy theories much to explain the world we share. The plain facts are more than enough for me.
But I grant you that Bush and Blair pulled it off - though in the case of Bush, he threw away 50 years of accumulated respect and power for America for a few billion barrels of oil - which we may discover was worth much more than we had thought while discarding it so casually. Of course, as Bush has been a proven failure his entire life, there was no reason to think he would fail to live up to his immense promise as president - I, for one, think he has.
"If you're going to believe the conspiracy theories then you have to admit that they've been damned effective at what they are doing."
How so? Yes, the military-industrial complex and all those connected have done well. But the empire itself is threatened which is why Brzezinki, Soros and other parts of the elite are very nervous. Both these guys and others have played big games and yet say these guys are not playing wisely. Hitler palyed his hand very shrewdly given the hand he was dealt, and yet he made colossal mistakes also. Ultimately the game he was playing was not winnable. I believe that's even more true today. I don't think the empire game can be won by anybody anymore. Nature is no longer willing to supply the wherewithal. "Time to grow up kiddie" she says.
Conspiracy theories are interesting and often very entertaining, sometimes there also true! Conspiracies do exist in our world. One could argue that most politicians are continually involved in some kind of conspiracy. Some contend that politics is the art of the possible. I would rather call politics the art of conspiracy.
Noam Chomsky talks a lot about the "internal record", what he seems to mean here is the real reason nations do the things they do. It's the way the leadership negotiates and communicates and takes decisions in private, not the rubbish they say in public for consumption by the television age.
Calling someone a believer in conspiracy theories is like calling them nuts, it's highly perjorative, and is often used by people to kill an inconveniant or troublesome story stone cold dead. The story may be true and amazing, but frame it successfully as a nutty conspiracy theory and it's dead, at least in most of the mainstream media and in polite company.
One fascinating story that was backed-up by lots of documentation, but was buried under the "conspiracy theory" tag concerns the US government's involvement in buying and transporting vast quantities of illegal drugs into the US. Apparently elements in the army, airforce, FBI and, CIA, and several police forces were involved in the opperation. Vast somes of money were generated. Money that was used to finance terrorism in central america and financed the purchase of weapons illegally and without Congressional approval or oversight. This was part of the Iran Contragate scandal and was never really investigated fully, not right to the bottom of the stinking shit pile. Part of the problem, and the really scary and potentially explosive part of the "conspiracy" was connected to where the drugs ended up and who eventually paid for them on the street. The drugs ended up on the streets of the major ethnic ghettos in the great cities of the United States. Clearly this was going to have major economic, social, health, and law enforcement implications for these areas. However, one could argue that there were "upsides" to this massive influx of hard drugs into the ghettos. First, drug induced passivity, one may be fucked, but at least one is "beautiful". Secondly, the destruction of any form of political awareness or social resistance to prevailing social structures and power relationships. Let the gangs take over the ghettos and fight amongst themselves, as long as the struggle remains confined to the ghetto area.
So it turns out "The Godfather" isn't really a work of fiction, but more a kind of analogy about the nature of society and the role of the state.
If you believe that Soros and others have the best interests of the "public" at heart, I have a bridge in Brooklyn to sell you. Small bills only please.
But seriously, I find the jockeying between the vast majority of Democrats and Republicans to be largely a game of musical chairs, jockeying for power while trying to leave the other guy holding the bag. Are Soros and friends nervous because we've truly harmed the US or are they nervous because the end game has started and they are the party out of the white house?
Ghawar Is Dying
The greatest shortcoming of the human race is our inability to understand the exponential function. - Dr. Albert Bartlett
"I don't think the empire game can be won by anybody anymore."
That's assuming your playing for the Empire. If your playing for yourself, great profits are there to be made. Especially if your spending the empire's money and troops to make it.
Well, yeah, some dead soldier plus about a trillion dollars when the last dog is hung. Thats about an extra $10 a barrel if they get every drop of Iraqi oil.
I tend to agree. While reading this has been as fascinating as a good detective story, I'm reminded of the scene in "Oedipus the King," where Oedipus, Jocasta (wife/mom), and Messenger are arguing about the importance of the death by natural causes of Polybus (whom Oedipus has mistaken as his biological father).
Um, it doesn't matter. He's already killed Laios (his biological father), and The Grand Atrocity is staring him in the face in the form of his mother, Jocasta, with whom he has already fathered four children.
Shortly, we'll see Jocasta's brooches gouging out Oedipus's eyes.
fine... but who exactly are you calling a m...
I agree that even if this scenario is correct it has been overtaken by events. And even if that rise in production at the beginning of 2004 was caused by disguised Iraqi oil as opposed to actual Saudi production, all it did was offset the decline curve by a year or so - much like the effect of Haradh III in Stuart's earlier posts.
If USA/KSA actually did something like this, they may have overestimated the ultimate decline rate when they put the plan in place back in 2001. I can see them expecting 2% to 4%, and figuring they could bring on new production in the breathing space this would give them. An 8% decline and no arrival of major new production would have "overrun their position".
GG : Interesting theory, but at the same time, Iraq's production figures, post-war, look plausible in themselves (of the order of 2M barrels per day). I presume that this is measured at the points of production, rather than at points of export. I think we can exclude the possibility that the real figure is actually much higher than this, though I have no idea if the numbers can be presumed to be accurate.
Are you suggesting that there is double counting going on? e.g. that 1M barrels per day, half of the Iraqi production, is piped to Saudi then re-counted as if it were produced there?
It looks to me as if the situation in Basra is just anarchical : lots of baksheesh, everyone has a financial interest in non-transparency, militias funding themselves through smuggling, the occupation forces overwhelmed.
I'm suggesting the oil is only being counted once - in KSA. The meters that would normally measure the oil at the point of production are apparently missing/broken . That would mean the oil would not be counted in Iraq at all. The chaos may be keeping that little fact from being noticed.
Yes, but since Iraq is officially producing in the region of 2MB/d, which is consistent with prewar levels, this means that you are arguing that they have secretly INCREASED production substantially over those levels, in order to provide a fat surplus for the saudis. This needs close analysis, to put it mildly, because it doesn't look plausible to me.
Yes, you're right, I got overly enthusiastic there. Given that Iraq's production was 2.4M to 2.5M range in 2000/2001 according to the BP Statistical Review, I can see 500K going missing, but 1M would be pushing it beyond the bounds of reason.
I recall reading somewhere that before the war, Iraq was not producing at full capacity due to the embargo. Does anyone know if this was true? And if true, how much under-capacity were they?
The BP spreadsheet suggests they were producing about 500K under capacity. Production of 2541K bpd in 1999 and 2583K bpd in 2000 fell to 2035K in 2002. Current reported production is probably 1800 or a bit less, so they're now down 700K to 800K from 2000.
Thanks GG! That seems to fit with the depleted data center in my brain.
Try 3.5 mb/d in 1990 before exports were halted by an international boycott. There's your 1.5 mb/d.
http://www.fas.org/man/crs/RS21626.pdf
And has the potential to produce 8 mb/d.
http://www.alternet.org/waroniraq/43045/
Looking at the map of SA where the IPSA meets up with the east west pipeline, it looks like it would be easy to tie the together there and then, even internally, the oil would look like it is coming from the Khurays and Ghawar and no one even at the pumping stations on the coast would even see a reduction in flow (rumor control for SA).
Enticing hypothesis...and frightening.
But everything previously written attributes the oil shortage to the destruction/closure of the west pipeline. The oil going that way goes by truck from Kirkuk, and pays whatever "taxes" are needed to criminals and insurgents.
Truly impressive work - and a fitting title, though something like midnight at the oasis also comes to mind.
And a nice dismissal of CERA - '12.7 million bpd' as a Saudi production figure in 2005 was certainly worth every penny CERA's customers paid to learn that fiction is more comforting than cold facts subjected to rigorous analysis.
CERA claims that this is the "production capacity" of each of the sources they analyze, not that they actually produced at that rate. And I can assure you that when oil is $100 per barrel and global production is below 80mbpd, CERA will still insist that "production capacity" is at 90 or 100 mbpd. They'll even excuse the lowered production numbers by saying they are justified in light of the recent recession, or some other such nonsense.
You cannot win with the liars at CERA. They live in a fantasy world all of their own making.
Ghawar Is Dying
The greatest shortcoming of the human race is our inability to understand the exponential function. - Dr. Albert Bartlett
Thanks. I was going to ask how CERA comes up with that number.
Stuart,
superb article! I am still digesting the implications. It would appear that Ghawar will not fade at a continuous uniform rate and that we can expect sharp falloffs as each of the "independent" regions waters out. This will make the Saudi production curve very difficult to simulate.
Great work. About the only additional thing I see, is that even though they may have a thin layer of oil above the water, getting it out with a horizontal may be impossible. You might have to drill a vertical right into it.
Whoa..
[/neo]
Great article, Stuart! It adds another explanation to why the Saudis are so secretive - knowledge is power, and a thorough understanding of present and future KSA production could be very damaging to the status quo and TPTB.
Very illuminating.
It looks like, what with the well productivity nose diving, that the Saudi's
are in a red queen dilemma.
Drill as fast as you can to stay in place. Except they are failing to
do so.
Well, the article illustrates that there's actually no point in drilling any faster -- at least, with respect to northern Ghawar.
They could presumably boost production by sucking harder on Uthmaniya and Haradh, but at the expense of sustainability I suppose : that would presumably create turbulence, increasing the amount of unextractible "green" oil.
If they have major reserves elsewhere which are merely awaiting development, then it's indeed puzzling that they are not drilling more. As they are exhibiting remarkable competence and careful husbandry of their existing fields, it seems likely that they saw this coming, and would have lined up more production if they could. That would seem to indicate that they don't have all that much more to develop...
Great article, Stuart, comprehensive, credible, reasoned. Fills in a lot of gaps and answers many questions raised last week when this topic was discussed on the Drumbeats. Thanks.
If only we could analyse Uthmaniyah and Hawiyah to a similar extent.
Next up on mega-projects in Saudi:
Khursaniyah/al-Hadriya/Fadhili - 500 kbpd due sometime in 2007
Shaybah extension - 300 kbpd in 2008
Khurais - 1200 kbpd in 2009
From any oil producer's point of view, there are two options: maximise product output via diligent husbandry of all resources using latest available technology OR maximise net present financial value of resource through using latest available technology to produce at maximum possible rate for as long as possible, before exhausting the reervoir and leaving what remains as "nodding donkey" production for decades.
State companies have more incentive to develop in the former style, whereas publicly-owned companies favour the latter, particularly so these days where they run the risk of seeing their reserves "resource nationalised".
Saleri said Ghawar total was 5.1 MMBOPD in 2003 with 33% water. That means 5.1 MMBOPD and 2.55 MMBWPD.
AD/S was 2 MMBOPD with 36% water. That is 1 MMBWPD.
I need help with the Haradhs but I think we are looking at 1 and 2 with 0.600 MMBOPD?? They shouldn't be making water yet at 10% depletion as Saleri says.
So that leaves 5.1-2.6 = 2.5 MMBOPD Uthmaniyah
2.55-1.0 = 1.55 MMBWPD """"
and the water cut in 2003 is 38.3%. More mature than ADS.
As for Hawiyah, Stuarts fractional flow curve above answers our question, 43% initial water saturation and 30% residual oil saturation- it just isn't in the same league.
I think Haradh might be very fractured. I think #105560 is talking about Haradh (though it's very coy about what field exactly is being discussed).
Stuart-
You are a quick study.
Use Darcy's Law
q= .00708 Kh/U (Pst-Pwf)/(ln(re/rw)-1/2+s)
and PI = q /(Pst-Pwf) q/delta p (bbls/psi)
Then you will find from Greg Croft data that Haradh has
4 times the observed PI for the reservoir properties of any other area.
It's performance is 4 times greater than its perm and thickness would suggest because it is so fractured.
"As for Hawiyah, Stuarts fractional flow curve above answers our question, 43% initial water saturation and 30% residual oil saturation- it just isn't in the same league."
This makes the assumption that the pre-production oil layer is at the bottom of the ff curve. I can see that if during filling of the reservoir it was water saturated then even geological time isn't enough to displace the residual water, hence the reservoir starts out at the intersection of the ff curve and the x-axis. However, is this the only way it could happen? What happens if gas gets there before the oil, could that drive out more water? Or what if the reservoir got hot enough to boil the water in it at some point, might that not leave it dry when the oil showed up, allowing an initial 100% fill of pores with oil?
If gas is trapped there before the oil, it still does not have the ability to drive the water out (there is connate water saturation in every gas field in the world as well). And if the gas were in the trap, it would either have to dissovle in the oil or there would be a gas cap.
It terms of boiling, the temperature would have to be plenty high for that pressure cooker.
Google capillary pressure. The fillage (and initial water saturation) is governed by the gravity force available, the interfacial tension between the wetting (water) and non-wetting phases (oil), the radius of the pore throats, and the contact angle between the wetting phase and the rock. Smaller diameter pore throats with high clay content have higher capillarity and thus higher initial water saturations.
carbonates generally have a strong affinity for water.
Fascinating. A major piece of the puzzle drops into place.
Just piecing together stuff I learned from this, and Euan's posts :
It seems that the early production techniques (poke a straw into the ground and suck hard) have seriously degraded northern Ghawar (Ain Dar and Shedgum) : nearly all the oil remaining is "green" (50 to 70% water) and not producible at all, or only at a very slow rate. I presume that this is because the primitive production techniques created great turbulence, provoking major mixing of oil and water.
Uthmaniyah was, one presumes, better managed, and exhibits much less mixing.
Haradh is being managed scientifically. They claim 50% or so increase in overall oil extraction, resulting from horizontal wells produced, it seems, at a slow, measured rate. This is presumably because it minimises mixing, and maximises "pink" extractible oil.
So it seems certain that Northern Ghawar is dead... (long live Daqing!)
AlistairC, I don’t think you have it quite correct. Oil that is 99% water is still “producible”. It is just producible in much smaller amounts and much more expensive to separate the oil from the water.
Mixing simply cannot be helped. You must inject water in order to keep the pressure in the reservoir. Water will often find faults in the reservoir rock. A well may water out in the very center of the reservoir because of a fault in the reservoir that channels the water to the well. It may be that Uthmaniyah has fewer faults than Ain Dar or Shedgum.
This extra production is yet to be verified. I doubt seriously that a greater percentage of the oil in the reservoir will be recovered from Haradh than from Ain Dar. In fact it may be less Because the oil is heavier in Ain Dar therefore it has a higher viscosity. Also the average porosity is less in Haradh, 14% verses 19% in Ain Dar. But far more important the Average Permeability is over ten times as great in Ain Dar as in Haradh. It is 617 millidarcies in Ain Dar but only 51 millidarcies in Haradh.
http://www.gregcroft.com/ghawar.ivnu
In the end I would expect to see far more oil left behind in Haradh than in Ain Dar. (Per cubic meter of reservoir rock of course. But because Ain Dar is so very much larger, far more oil will be left there.)
Ron Patteson
This would also explain the infield drilling that HO remarked upon last year, IIRC. They're going for the small remaining pockets of oil.
Stuart
You have taken the ball and scored a touchdown...
Now tell me why the Western Xsection in Uthmaniyah is BS looking at the Fractional flow curve which your intense work has found.
And predict the shape of the wet area % graph for North Ain Dar- it must eventually reach 100%.
And is it not true that if More oil is called to meet market demand from Ain Dar when that % wet area curve is reversing itself.. the dry area is maxed out... that the only remedy is to increase throughput (injection)... which I believe Aramco has announced.
Note that there are only two conditions of importance in a foot or millimeter of pay with regard to the fractional flow curve in a producing well.... whether it is pre or post breakthrough. The tangent construction is the important part... what is the saturation behind the flood front. What is left after the flood front. You don't have a FF curve for Ain Dar but Saleri and the SPE paper provide the end points. There is very little room for sensitivity on the average behind the flood front in between. Look at the Ain Dar cross section between 1990 and 2004.... how much does the water saturation change in the "wet area". This is the level to which there rock is being swept. There are no reserves above this water saturation.
To all who claim this is irrelevant... Simmons wrote a book twilight in the desert and went on tour.. he was talking about the bubble point/dew point in Ghawar which are totally irrelevant. He brought Saleri to the table... but the petroleum engineering world dropped the ball on what Saleri said. All those critics of Simmons did was compare the 2 resume's without doing any work. Saleri said Ain Dar/Shedgum would be producing 2 MMBOPD at "modest water cuts" for decades... it is a recorded transcript... it is the smoking gun.
Stuart needs to film a documentary -"Nansen and Me".
FF
http://www.spe.org/spe/jpt/jsp/jptmonthlysection/0,2440,1104_11038_57420...
Yeah, North 'Ain Dar is toast.
Re: Saleri said Ain Dar/Shedgum would be producing 2 MMBOPD at "modest water cuts" for decades... it is a recorded transcript... it is the smoking gun
It is quite incredible that we can read Water Management in North 'Ain Dar, Saudi Arabia (SPE #93439) on the one hand, and be expected to believe Saleri's statement on the other. What a bunch of nonsense.
Dr. Faten Alawadhi, Dr. Fatih Birol (IEA) and
Mr. Nansen Saleri discussing their post-peak plans
Thanks - yeah, I've been trying to infer the approximate ff curve for Ain Dar by cross-correlating the color changes (or lack thereof) between intervals. It's interesting that Uthmaniyah looks more cleared out (if unevenly) than 'Ain Dar...
"It's interesting that Uthmaniyah looks more cleared out (if unevenly) than 'Ain Dar"
I agree with your comment, but it does not make sense that this should be the case.
We know Uthmaniyah is a lower porosity/permeability reservoir with higher viscosity oil. Shouldn't this result in a picture where Uthmaniyah has a lower Sw and a higher water cut than Ain Dar?
In other words, how did Saudi Arabia seemingly manage to produce a lot more oil from a relatively lower quality field?
I can see that improved water flood and drilling technology would help. Was Uthmaniyah deveoped that much later that the entire difference could be explained by technological advance?
What is missing from the Uthmaniyah paper is the oil production overlain on the water cut.
Why?
Exactly - definitely seems like a dog that didn't bark.
The water saturation of 90% + in West Uthmaniyah is impossible with the fractional flow curve.
This is the Ain Dar/Shedgum curve I derived with Honapour correlation for intermediate wettability carbonate. It yields 66% water saturation behind the flood front which matches the xsections. It also direclty ties to Saleri pie chart.
I'm trying to get to grips with understanding the potential issues of inhomogeneity in the oil. The reservoir simulation show the 1940 oil-water contact (OOWC) tilted with the OOWC lower at the edges than in the crest (if my placement of the cross sections is right). A paper I was looking at last night suggests the north south tilt in the Ghawar OOWC is due to inhomogeneity in the oil. If this is also the explanation for the center-edges tilt in the North 'Ain Dar OOWC, it suggests that the oil at the edges is heavier than the oil in the center (possible if bacterial action has been stronger at the edges).
However, this seems somewhat inconsistent with the apparent tendency of the flood to have done a better job near the edges than nearer the center.
Another possible explanation for the latter is that the flood is less uniform further away from the peripheral injectors (due to fracturing etc).
At any rate, significant inhomogeneities might make straightforward application of a ff curve for an unknown location to the whole field imprecise.
Thoughts?
Stewart-
Most water oil contact tilts are thought to be hydrodynamic in nature. There is a water velocity in the aquifer (an outcrop or subcrop is in hydraulic communication with the aquifer and there is a flow causing a pressure gradient which pushes the oil to one side).
I hate to do this, but the man responsible for describing this mathematically was none other than M. King Hubbert and the "hubbert flow potential" is studied in graduate reservoir engineering classes.
Most of the recent work on Ghawar I have seen ties the tilt to the water salinity. The water is fresher on the West and thus a longer column is needed to get pressure equilibration at depth with the saltier (heavier) column on the East. Wild.
A reservoir engineer ran a model and needed to go from .10 to .95 water saturation on the West side of Uthmaniyah to get a history match of the oil recovered. That is what we know or what we think we know.
Note that Ghawar is defined as the largest field in the world for one reason- it is in hydraulic communication from Fazran to Haradh. So, if the water drive on the West Side is restricted due perhaps to a tar mat.. and this area was produced heavily in the early years, what kept oil from migrating there from the South???
So you run a reservoir model and you can't find the oil the West side has accumulated. Change the relative permeabilities to sweep it clean... it's easy.
Or it could be that the mobile oil saturation is 85% of a pore volume. But to achieve a 95% water saturation (some mobile oil is obviously not recoverable in the field) ... there is no residual oil saturation.
You are correct though that fractional flow and relative permeability varies across a field and across the depth of one well. What we end up in the simulator is what matches the performance.... period.
"what we end up in the simulator is what matches the performance....period."
and i would add that that solution is not unique.
And I would Add that
For Ain Dar/Shedgum.
For all intents and purposes there is one set of data that:
1. Honors
A. 68.4 Bbbl OOIP
b. 17.1 Bbbl contingent resources at a 21% SOR
c. A resulting 15% connate water saturation and 21% ROS
d. An average water saturation at breakthrough of about 65% which matches the cross sections from the SPE paper.
It is the curve presented above.
Could you post that chart in greater detail please? I cannot read the script on it.
Here is the reservoir fractional flow curve in better resolution.
Moses didn't bring this down from Mt. Sinai.
Anyone with Microsoft Excel can generate it.
The important part is it matches everything we know or everything we have been told- take your pick.
i will accept that this model has achieved AN history match using a single ff curve(was this not how the model was formulated ?) the real question is : how good will the model do in forecasting future performance ?
The only thing I can think for Uthmaniyah is that the rock is much less homogeneous than 'Ain Dar, and the "typical" ff curve there is not as typical as all that.
Could it be a cross-section of the one of the famous Super-K zones
A few things in the data I find a little confusing. I ran flowmeters on most of Ghawar from 1984 to 1987. I can't recall a single one that flowed less than 14,000 bpd down hole. Actually, 18k through a 2 7/8in choke was the norm. To get a 6,000 bpd surface measure these wells would have had to have a HUGE water cut and a shit load of gas.
Also, though my memories a bit foggy on this, I thought Shedgum ran full while Ain Dar was shut. The GOSP at Shedgum was never shut. In fact, for much of 86 and 87, we couldn't shut any wells attached to that GOSP.
During that time much of Safaniyah was shut. When I left in 1987, Utmaniyah was shut, harad was beyond shut. I'm not sure aramco could even find the wells anymore, as half were sanded in.
I personally shut all of the heavy oil project in Safaniyah inland. Personally, I thought that project was worth more than Aramco did. The wells were shallow and the column was about 200 ft thick. The wells (probably 30 of them) flowed about 6,500 bpd to a flare. But I perforated these at a rate of about 4 shots a foot. The wells were 6,000 ft deep and had no sulfur. This was an awesome field. Aramco scrubbed it. I made $30,000 on that field. It still gives me the warm and fuzzies.
I worked very sparingly offshore, mostly because of the war. There were only three jackups in the north off Abu Ali. If I recall, they were all work overs. Anyway, all we did there was set plugs and the wells were filled with deisel.
Aramco now has 12 (at least, Rowans sending more) jackups so I'm wondering if it has the same water problem Shedgum and Din Dar has. Also, BTW, we ran several neutron logs on the flood front advance in 85-87. If there was supposed to be a gradual advance we never saw it. In retrospect, the field probably was channeling.
What I'd be interested in is why nobody talks about Abqaiq. Those were the highest flowrate wells. In one test, Abqaiq flowed 57,000 bpd in 1983. (That was the down hole rate.) My impression was that Abqaiq was a major field.
Great stuff!
... is there a translator in the room?
Yes, I'll second the motion... can someone please give a one paragraph translation of Stuarts original post, to explain what this means regarding the potential timing of peak oil and future Saudi Arabian production.
Does "Shut" imply that it can be re-opened? As the harsh reality sinks in, will the Saudi's be able to resurrect these fields (with or without drilling) ? It would only slow the decline, of course...
CW
Global peak: 2007 - 2010
Global decline rate, Post peak: 2%
Economic response: Severe global recession, ~5 years, then slow recovery
The data above show well productivity on average at 10kbd in 1985. Add a 1.34 formation volume factor, and you've got 13.4kbd of oil downhole. Add 20% water, and you've got 16kbd - in the range you experienced.
I think Abqaiq is watered out, right? The Baqi/Saleri CSIS presentation showed it as by far the most depleted field.
"A Picture of Depletion," by Heading Out
http://www.theoildrum.com/classic/2005/06/picture-of-depletion.html
One last thing. I'd be stunned if your analysis was wrong. The only possible reason to horizontally drill Shedgum field would be water. When I first read about that project I started buying drilling companies and Canadian oilsands assets. WTO, COSWF, HTE, RDC ... these bad boys are good for about 300% BY 2010.
IMO, tar sands future production is under threat from declining ng/personnel availability.
Have a look at ard/gpor, two oily us e&p's with rising reserves, production and net. I think NA ng due to rise sharply on account of crashing canadian supply, so also like gassy gmxr.
Incredibly fine work, Stuart! It must have taken a lot of your time and some really intense work to dig out and correlate all this data and then formulate a reasonable hypothesis about what is really going on in Ghawar. I find it compelling and scary as hell, especially the certainty we are heading down a hole of near but uncertain timing.
Thank you, thank you for your contribution.
Apropos of that, I have seen a real sobering of comments here at TOD as the evidence has mounted recently that we are indeed in deep shit. I think the abyss facing us is finally beginning to seem real.
Three points:
1) Looking closely at these cross section plots of volumetic water saturation its noticeable how little yellow and orange show up in the plots from today. The contact between red(<25%) and green (>55%) is virtually instant. Is this a consequence of well management or water front? At a rough guess anything green is equivalent to 20% oil rather than the 80% of the red area which implies a very swift demarcation between the two states and either a very steep line, or active control.
2) If post 2004/5 this field went into sharp decline - is there any evidence for the transition in the processing/shipping activities of SA? Such a massive change in water cut and oil produced ought to show up in their activities. The increase in wells drilled in one such change, but are their others associated with tranisitioning to the disposal lifecycle stage?
3) The plots are interesting and provide one more way of predicting peaking and decline in aggressively managed fields. Do we have any other pairs of water saturation simulations / fractional flow graphs for other areas that could be examined? In addition, is there anything we can say about decline rates from these fields, post peak? The date of the peak is less important than the decline rate and predictions of how existing fields will react in future would be useful.
"1) Looking closely at these cross section plots of volumetic water saturation its noticeable how little yellow and orange show up in the plots from today."
I'm guessing that's due to the scale of the cross section.
Compare the 1990 and 2004 cases. Within the gridding resolution of the simulation the yellow/orange just disappears over this period (compared to 2-3 grids before). My non-expert eye would expect to still see a sliver of transition - unless something weird is going on.
To me the data suggests a cliff edge in production, since the only way to keep up oil volumes after the pink is gone would be to substancially increase water injection, which would then rapidly rise up that fractional flow graph for the entire field.
Garyp-
Point #1 is the point.
I broke out in Wyoming where we had 100 centipoise plus oil viscosity. Ghawar is 0.68.
In Wyoming, water injection would breakthrough in 90 days on 80 acre spacing and most of the oil recovery occurred above a 90% water cut. Oil was still being recovered 40 years after breakthrough from a specific interval. Envision an analog circuit where each cube of reservoir is a capacitor that discharges over time.
Ghawar is a logic circuit. A foot breaks through it is a 0 or a 1. Notice the lack of change in water saturation between 1990 and 2004 on the xsections, and your astute obs of the sharp "shock". "For those who are interested, the calculation of saturation shocks is akin to the method of characteristics, commonly applied to traffic flow problems as a partial differential equation solution technique. This becomes of interest if you introduce say CO2 into the analysis, and it becomes a multi-component problem. "
These observed physics are all due to the fractional flow curve. OIl and water viscosity are buried therein.
Fractional_Flow
Thanks for that, the binary nature of this more abrupt than I had given it credit for.
Cutting out the beating about the bush, I'll guess that you have relevent data for more fields than just Ghawar - around the world. Combining the water saturation and the fractional flow data would yield good estimates of how much recoverable oil is left, and how sharp the shock would be for those fields (including when its due).
Have you looked at this yourself? What does the big picture look like?
As I said in point 3 - its detailed and technical and its possible to get wrapped up in the fun of picking apart the detail. However the big question is what kind of production wall we can expect, and when?
Thanks gary,
re: "What does the big picture look like?"
Perhaps he's done it, or perhaps he's pointed the way and is waiting...
Don't ask, don't get.
I've seen this type of behaviour before. It can be difficult for someone to get ideas accepted if they are significantly different to the main drag. However once the basic interest is there you should always disclose the entirety of it so that people can build on the furtherest extent of your ideas - not go over old ground.
From where I stand I think this leads to a slightly better understanding of reservoir depletion, based on some elements of data that might have slipped out. However, the question after that is 'so what'? We might be able to put a slightly more accurate date on the global peak, but the really important question is what happens on the other side of that peak. That's governed partly by geology, but majorly by social and political reactions to decline. THAT is what determines the real consequence of peaking - yet that is where most avoid going.
By all means we need the best information possible, but its not an end, its only an input to the difficult questions.
Hi garyp,
Thanks for responding and I didn't think as carefully as I should have.
Yes, I support your asking ff...I hope he will continue to engage. It seems he will.
re: "...majorly by social and political reactions to decline. THAT is what determines the real consequence of peaking - yet that is where most avoid going."
I agree. I am willing to go there.
What do you suggest?
I was thinking perhaps we need to set up an "action committee", or a way to organize. Because I have both examples and ideas that seem positive to me.
(If people have already made up their minds as to the outcome, I'm concerned about the discussion stopping at that point. I have the impression this happens, say, for example, anytime I've tried to discuss the issue of possible use of nuclear weapons.)
In any case...I'd like to support what you say here. Let me know how - ?
which wyoming field was that ? i know of one on 80 acre spacing where water broke through and "that was all she wrote" "turn out the lights, the party's over". of course there is more to the story.
Since KSA cannot make up its mind I think you have proven beyond a shadow of a doubt that a women is really in control of the kingdom and the king is just a puppet.
Very interesting. I especially liked the treatment of fractional flow. In this vein, I wonder what generalizations can be made about the benefits of resting a well, or a reservoir. When one is getting too much water, how long must one wait till things settle out? how does the percentage of water effect this wait? what permanent (or persisting) damage can be done to a reservoir?
What About Articial Lift in Ghawar?
With all this increase in water, at what point does the fluid column become so heavy that it won't flow any more and gas lift or downhole electric pumps are needed to maintain well flow? Any reports about pumps in ghawar?
It’s kind of interesting to go back and read the following NYT article from 2004. They have a reference at the bottom of the article to the increased use of artificial lift in Saudi Arabia.
http://www.countercurrents.org/peakoil-gerth250204.htm
Forecast Of Rising Oil Demand Challenges Tired Saudi Fields
By Jeff Gerth
New York Times
25 February, 2004
WT
A great find- revisiting the 2004 to 2005 time frame- a lot of information coalesces there.
We need more info from Aramco.
I guess we should you know what in one hand and wish in the other, huh.
One aspect of this maintenance problem that has occured to me is that Ghawar represents the best of the best--with the flows that it has been producing, it is certainly worth all the AOR efforts they can throw at it.
But as the big fields are depleted, we are left with smaller and more dispersed fields. All the infrastructure necessary to keep the giants flowing cannot be duplicated to the same extent for smaller and smaller fields. The second half keeps looking less and less encouraging.
With the period that begins with "F", I encourage you to obtain the Crude Oil Futures Curve data, and see how the structure changed wrt to the following 3 comparisons.
1. Front Month to Back Month.
2. Front 3 Month Average, to Back Month.
3. All Months (6 year average, aka 6 Year Oil)
I think you'll find the above data when laid down against KSR production to be equally intriguing as the Rig Count, and the Front Month price which you are already using. (Actually you appear to be using the OPEC Basket price.)
You might also use Total OECD Days Supply also for the period, beginning with "F."
PS: To the best of my recollection, you may be interested to know that the full Brent crude oil futures strip, via ICE, did not become available to retail investors electronically until sometime in 2005. And that the the same electronic availablity for the full WTIC Strip via NYMEX was not available, until, on a roll out basis beginning in late Spring 2006. You should also know that volatility in Front and Next Month Crude has likely been enhanced by the appearance of retail available investment ETFS (exchange trade funds) that began to be available in 2005, and are often battered themselves every 4 weeks as they attempt to roll contract positions forward, and are gamed or "front-run" by the traders. The implication here is that in the past 18 month, it has been increasingly meaningful to think of the price of oil frankly as an average of at least the nearest 2, if not nearest 3 contracts.
Although I do not have the data on the changes that hit crude oil futures curve structure over these periods, I will just say as someone who has traded in energy equities and who has watched Brent and NYMEX trading action for several years, that the period beginning with "F" did indeed mark an acceleration in investment demand for contracts all out the curve, and most notable of all was when the Back Month(s) of the curve (2011 and 2012) failed to fall proportionately in the post Hezzbollah-Israel War (JUL-AUG 2006) price fall of Front Month oil, from 78.00 to 60.00. The multi-year promise of a 6 year contango (the backwardation kept slipping away) in oil was realized in 2006, and this is noteworthy to say the least.
Cheers.
Gregor
I agree, Gregor. A comparison of the USO ETF vs WTI crude shows exactly the point you're making. I don't think many retail investors have appreciated the rollover hit they're taking with the current steep contango.
Graph of USO vs WTI
From the traders point of view it must seem as though Christmas comes twelve times a year.
That's exactly right FTX, and when the USO prospectus was released in early 2006 I wrote on Silicon Investor that people should avoid it like the plague because USO was about to make the same mistake that the original Brent-based ETF on the LSE had already made, which was to use Front Month and Next Month contracts as the investable contracts. Already at the time USO was launched, the London-based Brent ETF had begun its journey to be ground down to dust. Since that time a whole raft of other commodity ETFs have appeared, many of which have Energy as a component of their mix, and, which use near month contracts. The result of course is a widening spread beginning the 7+ days before every expiration as these price insentive funds must sell expiring front month, and buy next month. It's nutty.
I heard from someone that when the investment cmte. of one of the these commodity ETFs was warned prior to launch that a persistent contango in the crude oil futures could cause them to get hosed every month on negative roll, they responded with the all too familiar "Well, we don't think the curve will be in contango forever." Heh Heh.
Cheers,
Gregor
Whoa! This little thread might have just saved me a lot of money. Thanks, guys. USO buyers take note.
Is there any better way to hedge against a rise in oil prices without turning to the futures markets?
I'm glad someone else has noticed the historic shift to contango in the oil markets. If smart investors moved 5% of their portfolio to oil as the contango suggests we should. I think oil would move close to its true value.
Recent reports of oil selling for $300/barrel retail in Turkey is a realistic valuation based on the work performed by a barrel of oil. Horses put out 33,000,000 N-m per day or 31,000 BTU per day at a cost of $10/day. Since this is about 1/4 of a gallon of gas. The equivalent is $40/gallon or $300/barrel. Turkey is not far off.
Congratulations, Stuart. I wish the discussion had started here, instead of this being the 3rd installment.
Here's the crux of the matter.
I've saved, and have now looked at, the "bootleg" SPE #93439. Anyway, one look at your Two cross sections of a reservoir simulation of the northern portion of the 'Ain Dar (Figure 9 in #93439) told me it was all over but the crying in that part of the Arab D carbonate reservoir.I will say that I always said that the Northern Ghawar "sweet spot" was no doubt declining and that the Saudis were trying to fight off declines there from their new "megaprojects". So, please don't shoot me!
However, a putative 45% of 2.0 md/d with maybe a 50% uncertainty does not tell us the whole story yet. Also, it would be nice to have the fractional flow graph for the relevant parts of the reservoir.
So, it is time for the Saudis to come clean and give us the current production data from 'Ain Dar/Shedgum. It's all about data transparency and always has been. This "peak oil" problem just got a lot more serious for me, and I was already really worried.
Nice work, Stuart, some of the best I've ever seen here or anywhere else. You've inconvenienced me — now, I have to rewrite some parts of a story I was doing!
Hello Dave! Good to see you around.
Yes, the entire issue has always been about transparency, as Simmons himself stated 3+ years ago. But there is more here. The truly terrifying thing is that if KSA is in this state, and if Kuwait is in this state (evidence is good that this is so), and if Iran is headed for this state, then global production could drop below 80mbpd by 2010 or earlier. I am not saying that it will but my gosh! At that point we won't be arguing about transparency but lots of us may be buying farmland.
However, your call to the Saudis to come clean will never happen, Dave. You know this. I know this. You know in your heart that they will obfuscate til they cannot and even then they will invent excuses rather than admit the party is over.
So... when you write your story, think about what a KSA refusing to admit to reality really means. And what a USA refusing to admit to reality and actively trying to manage perceptions instead of the real problems really means.
It's not pretty, sir.
Ghawar Is Dying
The greatest shortcoming of the human race is our inability to understand the exponential function. - Dr. Albert Bartlett
Fabulous, always look forward to your posts, this is best so far. Non linear water/oil flow discussion was very informative. Also, didn't know there was no gas cap - pity, thought they would soon have a nice gas field.
IMO, AD/S can go down 2Mb/d, without these fields they are at 7.5Mb/d... other fields are no doubt seeing difficulties. SA is not going to zero, but I can imagine 7.5Mb/d for several years even assuming future projects come on line as scheduled, less if they don't.
Wonder how russia is doing...
WT seems right to focus on exports, current trends seem more predictive than HL.
Strictly speaking, my original net export article was largely based on HL modeling.
I freely concede the point that Texas and Saudi Arabia are more complex than the Lower 48 and the world, but I think that the HL analysis gives us some very useful information, to-wit, that when we look at the entire Texas HL plot, we do get an idea of at what stage of Probable URR that Texas peaked, i.e., later than the Lower 48. Thus my reasoning that Saudi Arabia was on the verge of a production decline in 2005, which I illustrated with the Texas production graph, in 1972, lined up with the Saudi production graph in 2005: http://static.flickr.com/55/145186318_27a012448e_o.png
One interesting thing I concluded from all the recent HL discussions was that the 75 Gb estimate for remaining recoverable reserves for Saudi Arabia is probably on the high side. A 40 Gb estimate may be more accurate.
In any case, Deffeyes picked 2006 as the most likely year for a world production decline--same for Khebab regarding Mexico. Lots of HL "coincidences."
I think we can now safely put SA behind us.
With this information we can easily start backcasting the models using 2004-2005 as a known peak.
My initial conclusion is that KSA should have reached peak production sometime in the late 1990's if they had followed a logistic production curve. So now I think we are pretty safe in looking at deviations from the logistic and other models for a complex production scenario.
With KSA pretty much behind us the only wild card now is Russia if Russia can stay level or increase slightly and if we can squeeze just a bit more oil out of the rest of the world we might be able to stay at a gentle decline rate for a few more years. On the price side this means staying under the 100 mark for a barrel.
WT your right I think when the bidding war starts between developing countries we are in trouble. But on the same hand
this can I think be delayed via a combination of price squeezes on third world countries slowing economies and just the ability to offset declines in KSA and Mexico with production from projects comming online.
To me the real bidding war starts when we are about 4mbd down from today at that point the situation is obvious to all.
So assuming this anaylsis is correct and we can expect no significant long term increases in production from KSA how does this leave us with your export land model and mega-projects comming online.
When do we drop below the magic 4mbpd number and enter into a permanent bidding war ?
I had to guess at consumption rates (I assumed that the 2005 to 2006 increase was the same as 2004 to 2005), but based on that assumption I estimated that net exports by the top 10 net oil exporters were down by 8% from 12/05 to 12/06. This would mean a 50% decline in 9 years. If you plug in a Russian decline/collapse, I expect to see the 50% decline in five years or so.
Remember, it takes 100% of the Total Liquids production of the world's 14th largest oil producer, Brazil, to meet domestic Saudi consumption.
Note that Brent is back above its post-5/05 average monthly price of $62. I think that the bidding war between the EU, China and the US, et al, has started.
Remember--the UK went from (presumably) maximum exports to zero net oil exports in six years.
There is very good action in the 3 electronically traded curves today: WTIC (CL) on NYMEX, and both Brent (COIL) and WTIC (WTI) traded on ICE. (Yes, ICE now offers a contract on West Texas Intermediate). Volume is notable in DEC 08, DEC 09, DEC 10, and DEC 11 contracts. DEC 12 is available on all curves, but, does not have notable volume.
As I mentioned to Stuart it's my very general view that the presence of KSR in the seriously backwardated long end of the curve was a persistent feature of the post-war era (to the extent the long end of the curve existed). Long-dated oil was dirt cheap. Always. Because long-dated oil would of course be provided by the bottomless KSR and other OPEC.
But, beginning in 2003, the back end of the curve rose, and I think we'll learn that "intelligence about KSR's true situation", began to find its way into the long-dated contracts. It is law in the markets that price moves first, and you get the "news" later. The global oil market like the global forex and gold markets stands ever ready to recieve the "confessions" , if you will, of those who have superior information.
Front Month Brent and/or 3 Month Brent has been strong this late Winter, owing in large part imo to strong econ growth in Europe, the OPEC cuts, and that European refining capacity has had fewer problems so their throughputs have been steadier. Strong product prices here in the US/and weaker WTI are the same side of the coin to strong Brent Prices/normal product pricing in Europe, at the moment. This should settle out soon however. In general, the global oil market cares very little about the notion of a housing led slowdown in the US. There is no question in my mind that some of the volatile lower prices we've seen in 2007 allowed myriad players to pick up oil cheaply.
Meanwhile, longer-dated Brent goes for a discount to WTI, and conforms better to the historic discount between the two. But imo that discount will be gone by the time we get to 2012. The grade differences then will matter little, and geography and other considerations will close that spread.
Today's Pricing:
Brent: DEC 08 -- 68.21, DEC 09 -- 67.78, DEC 10 -- 67.08, DEC 11 -- 65.74, DEC 12 -- 64.75
WTI/WTIC: DEC 08 -- 68.72, DEC 09 -- 68.50. DEC 10 -- 67.81, DEC 11 -- 67.24, DEC 12 -- 67.26
Gregor
Do we know how much oil is actually shipped with these contracts ? Also it would seem to me that they way the market works real oil consumers have some protection from price increases since they can take delivery of the actual oil.
I'm wondering if you would mind shedding some light on what I call real oil shipments and contracts. I'd have to guess a lot more people are going to want real oil and not paper barrels. How many take delivery. How much oil actually moves through the open exchange and not via private contract etc. Is more real oil being bought on the spot market ? I would think the first effect would be for the number of real barrels bought on the spot market to increase. Do we know this information ?
We can assume the market will stay in cantago and the price will go up so what about real oil ?
This would be a great topic btw.
Thanks I don't think 9 years out is that important.
I.e I would be surprised if we continued business as usual out to 50% oil depletion.
From what your saying we could be in a 4mbpd split bascially this year. I think we should squeeze by into next year or very late this year.
At this point looking 6 months ahead is more important than 9 years out since we will be dealing with the effects of peak oil soon. Once supply is significantly less than demand
I don't think it matters too much how much less.
One problem I see is that 3rd world regions like Africa don't use a lot of oil now so starving them of oil does not give us much. So even if we basically take all the oil from the third world it does not buy much time.
If you consider the shear size of the oil industry I'd have to think that supply problems will take some time to reach
criticl status.
So whats your call on the short time issues i.e next 18 months assuming a price spike. There has to be some factors that will squeeze a few mbpd out of the system ?
folks, Stuart deserves as many readers as he can get for this...hit the tip jars for him. digg, reddit, stumbleupon, me-fi, name it.
stuart,,, i usually try not to be part of the amen choir, since i don't see the sense, but this is an astounding piece of work... your last three posts put sherlock to shame......we are not worthy...we are not worthy!
Wow Stuart, impressive work! And thanks a lot --- now I'm really worried and can't help but wonder if the recent Saudi cuts to Asia were so that they could supply the US during the peak season. After all, the Bushes and Saudis are very close and I would expect the Saudis to go the extra mile for GWB rather than Asian countries.
sa/kuwait are encouraged to continue our close and friendly relationship, both placing us at the top of their list in receiving their dwindling output and continuing to accept dollars for their oil, by the presence of the us army plus carrier fleets. Besides... they know that when tshtf, sa princes will receive preferential treatment for permanent visas.
Also, someone mentioned here that the recent decline in the Saudi stock market was mostly due to the Saudi royals pulling their money out of the market. If true, the writing is likely on the wall and those visas are being printed as I type...
Yeah, right....Just like Jimmy Carter rolled out the red carpet for the Shah of Iran when the revolutionaries ran him out of Tehran on a rail. Where did he end up?? Panama?? And the dude had cancer and the US couldn't even get away with taking him in as a charity case.
Besides, just whose military protects the princes?
Are you sure 'protect' is the correct verb?
And yes, by the way, I have known people who trained Saudi National Guard soldiers after retiring from the U.S. military.
'Its duties include protecting the royal family, guarding against coups, protecting strategic facilities and resources, and protecting the Holy Places of Mecca and Medina. It is both a standing force of 125,000, with a tribal militia of 25,000. The SANG is the King's private army consisting of personnel drawn from tribes loyal to the King and Royal Family. It is always commanded by a high ranking member of the royal family. The force was extensively reorganized and retrained by the Vinnell Corporation (using over a thousand US Vietnam War veterans) in the 1980s and performed well in the Gulf War/Operation Desert Storm especially in the battle for Khafji.'
http://en.wikipedia.org/wiki/Saudi_Arabian_National_Guard
Nothing like molding the King's own private army - sometimes, I think people have little grasp just how little the Saudis have to do with what goes on, except in name - including the bank accounts, of course.
If you can connect some of the dots (Prince Bandr, for example), the game is just too amusing. Oh, and by the way, the Saudi National Guard previously drove around in Cadillacs (though not quite the GM version).
That's pretty interesting. So maybe the correct term is more of a "captive audience." :-)
So...putting two and two together here(stuart and fractional) I come to this conclusion.
Most of the Persian Gulf is at or passed waterfront crest meaning that when Gulf production goes down it will go down rather rapidly with no warning.
And to top it all off, West Texas is forecasting exports to be HALF of todays level in 5 years!!!
If this really happens I cannot imagine the worlds response. Probably in between shock and utter despair.
I suspect that the world decline rate will be relatively low (around 2% or so), although I could be wrong, but from the point of view of importers, IMO, it will look like a crash.
Look at the UK. They are still a significant, though rapidly declining, oil producer, but their net oil exports have been zero since around 2005. What would the economy look like if the UK were the sole source of exported crude oil? Remember they went from one mbpd exports, which I assume was their peak export level, to zero net oil exports in six years.
As I have said a zillion times--and Robert agreed--ELP is a good idea regardless of whether the peak is this decade or next decade.
As we look at the mortgage meltdown, is there anyone on this board in the US who does not wish that they had unloaded their house and mortgage payment last year and rented an apartment along a mass transit line? Of course, the irony is that some other poor sucker gets stuck with the mortgage. Other than farmland, I wonder if owning any kind of real estate is a good idea, even in walkable mass transit oriented cities.
I feel guilty about the 'poor sucker' comment. I am about to negociate the sales price on my San Jose home this evening with a nice couple. Had them over w/ their realtor yesterday. Very nice people, asking all sorts of questions about this town home; disclosures & such.. I kept thinking in the back of my head I was leaving out the most important disclosure which is that w/o low interest rates and healthy tech jobs in Silicon Valley there is no way that the prices here can be sustained. A little voice in the back of my head wants to scream out to them, 'Gahwar is toast, dont u know!!'. The meme here is that realestate in the valley never goes down (they have 40 years of trend backing up that assertion). I keep wanting to compile a list of basic economic assumptions (or maybe 'faith based' economic assumptions) that people have that peak oil will blow out of the water.
The only hesitation I have about selling this place is that new light rail has just come on line within walking distance.
The realestate situation here isnt like San Diego or Phoenix or Denver,.,....Yet.
WT, I sold my house in Miami about this time last year for an insane amount of money and am sitting in my apt as I write this.
You and ELP deserve some of the credit and my gratitude.
And yes, I do feel a little sorry for the flipper who bought it. He put a lot of money into upgrades and all he can do now is rent it. Probably doesn't cover the nut.
WT, I sold my house in Miami for an *irrationally exhuberant* amount of money about this time last year, and am sitting in my apt writing this.
ELP was part this decision, and I thank you.
I do feel a little sorry for the flipper who bought the place. He put a ton of money into upgrades and now can only rent the place. Probably doesn't cover the nut.
Good luck to all of us.
In regard to the "poor suckers." I think that we are all going to be paying the bill for the mortgage meltdown.
A simple, low cost lifestyle sounds more appealing every single day. . .
More like Blame and War!
What I would like to know is why Fractional Flow is holding back? He seems to have guided us to this point in regard to the cross sectional analysis ( I think he dug it up ).
It seems to me that he believes that the truth is worse than even we think and that this years is going to be a rough road..So,FF, How Rough??
I agree and hopefully people can contribute information on the short term position.
I've taken what I think is a reasonable stance that once world exports decline by 4mbpd we are in obvious trouble.
Notice I said exports not production. Once this happens we have a obvious and basically uncloseable gap between production and supply.
According to Stuarts post we can't expect KSA to be able to increase production significantly at best the will be standing still +/- 1mbpd or so.
So we could see real problems as early as this summer or as late as 2008. Can we collect more information from short term sources even if its spotty. I for example browse for shortages reported. Of course the problems are never blamed on actual lack of oil but you would have to think that we should see a lot of places worldwide experience temporary shortages as deliveries fail to arrive.
If WT is right we should begin to see signs of this basically any day now or its already begun and we simply did not see
the articles. I'd have to guess that the first places effected will be areas where supply is bought without a long term contract.
Asia is obviously getting shafted by KSA this means they will buy on the spot market to make up for shortages. So someone else is not going to get oil. Googling should pick up these local stories.
For example this article
http://www.gulf-times.com/site/topics/article.asp?cu_no=2&item_no=139291...
About problems of oil quality is in my opinion a potential peak oil signal. So if we continue to see reports of quality problems this may be important. Whats not said is that they obviously did not have these problems before.
These point to increased demand.
http://www.interfax.cn/displayarticle.asp?aid=22416&slug=CHINA-ENERGY-FUEL
http://www.busrep.co.za/index.php?fArticleId=3749278
Since I think the first effects will not be in the major markets we simply should all spend a bit
of time looking for stories that indicate problems. Sooner or later we will start seeing more that indicate
real supply problems.
Another article
http://www.kantipuronline.com/kolnews.php?&nid=104315
Nepal would be a good country to watch since they are very poor. Why the shortages now and will they continue to get worse. If we are past peak it would seem that countries like Nepal will have problems. Indeed the hidden issue here may very well be that they have run out of money.
With Stuarts work and WT exportland model someone somewhere in the world is simply not going to get oil this year.
Well what do you know it is about money and its not too hidden.
http://www.kantipuronline.com/kolnews.php?&nid=104699
So Nepal has been demand destructed.
Holy freekin' crap. Mabel, sell the Suburban.
Thud. Gonna be tough to argue this one... I especially hate the nice smooth logistic curve you can draw through the Saudi production data, with the accelerating decline happening right on schedule... Halibut.
It would be nice to have the OECD inventories data in your "3 charts of the apocalypse" set, since that is another crucial input to the Saudi production performance historically. I know it would clutter the analysis even more, but it will be brought up as a counter argument anyways.
CW
Global peak: 2007 - 2010
Global decline rate, Post peak: 2%
Economic response: Severe global recession, ~5 years, then slow recovery
the inventory data is important. if we assume that the saudi's have excess capacity, then one could make the case that they were trying to outguess the market (and not doing so very effectively). a questionable assumption indeed.
West Texas. You say that exports will be down 50% in 5 yrs. What would total world production be at that time??
And if it is less than 70mmpd does that imply that the world will be at war?
Detail, details.
Based on some assumptions, I estimate that exports from the top 10 net oil exporters declined by 8% from 12/05 to 12/06.
The big "if" is Russia.
IF Russia starts declining or crashing this year or next year, I think that a 50% decline in net oil exports by the top 10 in five years is quite possible. After all, it's only about half the 100% decline in net exports that the UK saw over about the same time period.
Hmm not sure about this since KSA simply does not have the population to use all of its oil. I posted once before that their has to be a point where oil producing nations are going to cut subsidies since at some point they have to keep exporting or they have no money. Also as their costs rise the amount of money avialable for distribution via goverment projects will drop and maybe quicker than we think.
So at some point soon they will have to take a hardline with their internal populations to keep the flow of funds you can't rely on continued price increases to cover dropping production and rising costs.
This means that probably we will see countries like KSA and Mexico enter a state of military style dictatorship as the elite focus on retaining power. Or course this opens the door for a coup so...
You have to think that business as usual will end fairly quickly and certainly cutting internal subsidies to ensure cash flow will happen sooner than later.
I guess we should pay close attention to Mexico over the next year since I suspect whatever approach they take will be the one taken by KSA.
I just can't see these sorts of political/economic factors not becoming important and leading to even more problems.
So this poses the question when are the NCO's going to get squeezed ? The only solution seems require oil prices to skyrocket to prevent internal problems in these countries.
That's an interesting thought, memmel...
A nation that peaks ahead of everyone else is in big trouble. Oil supplies, though tight, are still at least stable so price is not shooting up - yet. Such a nation gets hosed as exports go down. They either cut domestic subsidies or lose income or both.
But what happens once you are clearly past peak? A nation that still can produce exportable oil is going to be able to ask whatever the traffic will bear. If I was exporting 7 mbpd at $60 per barrel but I can (in a few years) export 5 mbpd at $90 per barrel or even 3.5mbpd at $130, I've actually come out ahead. KSA needs price to rise to lead the way so that they neither have to cut subsidies nor lose revenue from exports. This in itself is a good reason to bring on peak oil, even if a bit early. If you know peak is at the door for yourself and every other major producer, why not hold back production in an attempt to drive prices high enough to make even more money?
KSA has high enough quality oil that they can find a buyer no matter what, unless we actually get a fast total collapse, which is almost impossible. But a slow collapse? They will have customers til they stop pumping. This presumes, of course, that after the initial drop in production that KSA can then maintain some sort of plateau for a number of years.
But if KSA declines like Mexico, in front of the price surge, they may be forced to cut either subsidies or government programs (which depend on oil revenue).
Is KSA trying to wait out the peak then ride the price surge? That would mean peak was really imminent.
Ghawar Is Dying
The greatest shortcoming of the human race is our inability to understand the exponential function. - Dr. Albert Bartlett
But what happens once you are clearly past peak? A nation that still can produce exportable oil is going to be able to ask whatever the traffic will bear. If I was exporting 7 mbpd at $60 per barrel but I can (in a few years) export 5 mbpd at $90 per barrel or even 3.5mbpd at $130, I've actually come out ahead.
They can get a lof of Dollars, true. But can they eat Dollars?
Arguably, they need to eat food, imported from the US, presumably, and to the extent US-manufactured food is one of the reincarnations of oil. "Prices" of food will go up with those of oil.
Ditto for other "products" that they might need to keep the population off the streets. That includes arms and keeping the force active. Curiously, that does not include coffins -- this is a one-time expense.
Stuart,
Great stuff!
I remember from a conversation with a petrologist that as sulfur content increases, the likelihood of the oil being trapped in the reservoir rock increases (binding). Would this affect the FF curve in increasing the steepness of the curve as sulfur level rises? If yes, would this increase the FF curve in general as one goes from the north Ghawar to the south which, as I recall, is both heavier and higher in sulfur?
Stuart, you may be giving too much emphasis to geology and not enough to politics. So I ask again, Is there more room for a political analysis here? Under your 3/8 Post, A Nosedive Toward the Desert, I said in part (slightly edited and [annotated]):
"Politics tempers geology. Stuart's post may give too much emphasis on the geology, leading to a too pessimistic downward projection in KSA production in 2007-10.
"The two KSA swing-production events in 2003-04 tend to distort the shape of the 2002-06 KSA production curve – the large [but brief] increase for the Iraq invasion is the clearest of the two, and the second larger surge (larger in area/volume, not vertical scale), MONTHS before the 2004 U.S. presidential election (the elephant in the room no one wants to mention - the KSA tribe looking out for their Bush tribe friends - can we forget the picture of the two clan members holding hands at the ranch?) If you [arbitrarily] level these out [to partially adjust for the possible politics at play], closer to the OPEC quota limits for these periods, and then extend the production chart back to 1997 [for visual perspective - close to the lowest price in real $$ since 1973], then the later KSA declines don't look so severe.
"(Note also that the steep production drop at the end of 2004 closely matches the price drop for that period.) [But it is only a fraction of the pre-election increase, in relation to the price change.] In addition to KSA's offset for the Iraqi production increase in 2006 [observed elsewhere today (3/8)], note also that Russia continues to increase production to the end of 2006. (The overlapping KSA-Russian production chart posted, sorry I forgot by whom, yesterday was telling in this regard. While KSA swings, Russia steadily increases from 2002-2007.)
"Assume KSA has economists and sees OECD economic softening, and demand destruction in the third world; it's not too hard to imagine them in July 2006 anticipating lower demand beginning soon and continuing for some time, thus jumping the gun on the price peak. An added geopolitical factor is KSA's growing impatience with U.S. failures in Iraq: this could explain their reversion in 2006 to more closely hewing to the OPEC quota limits than in the prior three years (don't listen to us, invade; oh, you failed... now we need extra $$ to defend our Sunni Iraqi friends...)."
When you compare the huge KSA production response in 2004 in Period A (coincidental with a modest price increase from ~$30 to ~$36/bbl) to the smaller KSA production response in 2005 in Period D (coincidental with a less modest price increase from ~$34 to ~54/bbl), you have two main factors to consider, geology and/or politics. My only point here is that KSA's huge 2004 production increase might be equally or more greatly attributed to the U.S. election than to just an exercise of their swing role. This is not "tin hat" stuff. Bush needed that boost and the resulting moderation of the price increase (change a few thousand votes in Ohio...): imagine how a price spike resembling 2006's would have changed things.
Just for discussion purposes, modify your chart by taking the slope of 2005's production increase and superimpose it on the 2004 period, starting at the beginning of Period A - - the result is a slope that increases uniformly, blending well into Period D, almost to the point of peak (the end of Period D, or just after).
Thought experiment, Stuart: If KSA's production curve looked more like that posited above (i.e., the Saudis refrained from playing politics), would you have viewed the production drop in the last half of 2006 with the same level of concern... and (will you) would you have been less surprised if KSA resumes a higher level of production as we go forward in 2007 (in their swing role, assuming no major demand destruction)?
P.S.: We can also ask whether/why KSA "let" the dems prevail in 2006 by NOT responding to the price spike - - were they just sending Bush a message (what do you say about a small country that gets to order the Vice President of the United States of America on a plane ("report to us immediately, we have a message for W"), that posts a veiled message in the Washington Post about their dissatisfaction with the treatment of their Sunni friends in Iraq, and, suddenly (check out the timeline for yourself) administration officials are dropping hints and making "surging" statements, and like, WOW, we get a surge...
________________
Re: "Exxon-Mobil CEO: Oil Volumes Will Keep Growing" Rex Tillerson says that "the world’s oil would not run out in his lifetime". Means nothing... this guy doesn't buy green bananas.
Another interesting political angle came out in this Drumbeat story yesterday:
Saudi Arabia Not Planning Oil Market Crash
The article reports on denials that SA has a plan to undercut Iran by engineering an oil market price crash:
The idea, I think, is that SA's aggressive drilling program is NOT a matter of "running as fast as they can to stay in one place" as I think many here assume. Rather, the claim is that SA is drilling so as to increase SPARE production capacity.
Reading between the lines, a possible scenario is of a U.S. or allied strike against Iran nuclear sites in a couple of years, at which time the wargaming predicts that Iran will (at a minimum) cut off its own oil exports. Now all that Saudi drilling pays off, as it is able to step forward and rapidly ramp up production so as to cushion the blow of losing Iranian oil from the market.
Whether this would all play out so nicely is obviously questionable, but as a major U.S. ally it is not that implausible that SA might be asked to take these kinds of preemptive steps in order to give the U.S. an option when the inevitable Iranian oil cutoff occurs.
The point then is in particular with regard to Stuart's calculation of well productivity showing an alarming recent decline, I think he assumed that all those newly drilled wells are going into production. And since there are so many more rigs than before, therefore a lot more wells, but production has not increased, it follows under this assumption that per well productivity must be falling.
However if in fact all these newly drilled wells are not going into production but are merely being held ready so they can be switched on quickly in response to a pre-planned international Iranian crisis, then Stuart's assumptions would be wrong and we wouldn't necessary see the fall in well productivity shown on his graph.
Is that what actually is true or is that what KSA wants you to believe, Halfin? Are you going to swallow that story, hook, line, and sinker, without any effort to validate it?
Ghawar Is Dying
The greatest shortcoming of the human race is our inability to understand the exponential function. - Dr. Albert Bartlett
But can KSA export increased quantities of oil if Iran attempts to blockade the Straits of Hormuz?
Pipeline capacity to the Red Sea and Jordan from the oil producing areas of KSA is limited, with the bulk (>80%) of oil from the Persian Gulf being exported by tanker through the narrow straits. The east-west pipeline across KSA to the port of Yanbu can carry 5mb/d, representing only about 25% of total Gulf output.
My feeling is that Iran could close the straits, or at least severely limit traffic through them, relatively easily. It would only take one successful strike on a tanker for operators to be unwilling to risk their staff and ships.
Thank you Stuart for your excellent posts, which are more like research papers, and for the comments by everyone else. And it's all free too...
What was the time difference between the US hitting peak and the US ADMITTING they had peaked?
Roughly the time in which a president resigned in disgrace, was replaced by a genial non-entity, followed by a Navy trained nuclear engineer, who is still remembered as a ridiculous figure in a sweater talking about the need to conserve. Then a B movie actor was elected president, and it was morning in America again. And America's current aggregate automobile fleet fuel economy is roughly the same as in the mid-1980s.
Truly, a simple recital of these facts is as fine a measure as any about how America recognized and dealt with peak oil within its borders.
Your knowledge of history is pretty darn good expat. Is that why you are an expat?
The basic reason I don't live in the U.S. is to keep my sanity, though there are a number of nice things about Germany.
Plus, events also just took their course.
As for history - I'm just describing what went on around me while growing up in Northern Virginia.
OPEC couldn't have picket their oil embargo at a better time:
http://en.wikipedia.org/wiki/Image:US_Oil_Production_and_Imports_1920_to...
I wonder if some global 'energy crisis' that 'explains it all' will hit us 2-3 years into the downslope?
Great post Stuart.
This is meat and potatoes to peak oilers. The rest of humanity who haven't bothered will not understand and cruise by. Still, its another piece of information, more evidence to confront the world with what is happening.
Right now, it seems the below ground issues are becoming more settled. There seems to be increasing consensus, supported by great posts such as this, that PO is now behind us. The challenge as ever is above ground - to get our useless politicans to act and to get the complacent MSM to report real news.
Stuart, I also wanted to say
"Great Job" to you and those who
assisted you with this piece.
Stuart:
This is the best post I have read yet on TOD. Congratulations, and good luck to us all.
Matt O
I presume you have this info already.
There are some graphics of 3-D for Uthmaniyah as well as oil column thickness.
Waterflood info apprears from 1996, oil column info from 2004, or so I interpret.
http://home.entouch.net/dmd/ghawar.htm
What we need is a real tip jar to put real money in. Anything to keep Stuart focused on this sort of work.
It's obvious that there are not many people capable of putting together this kind of analysis. And almost none willing to do it for free and for the broader public.
They recently introduced a tip jar at Calculated Risk.
http://calculatedrisk.blogspot.com/
'Twas a good idea.
The water, is it sea water, or fresh?
It is seawater. But even this is not usually as salty as the underlying aquifer in the reservoir. I think I read in "twilight" that the aquifer underlying the north end of Ghawar is six times as salty as normal seawater.
Ron Patterson
Am I correct in believing that it needs to be boiled or otherwise thermophile bacteria could create problems?
Once water injection begins, is the extent of well fractionation determined from output at the well head? From Stuart’s graphs, it seems as though actual oil output would vary from SW and SO and that that number might vary considerable from week to week, depending on where the oil is relation to the water, what the permeability is, etc..
There is a book called; "How Cuba survived peak oil". I would suggest everyone take a look at how Cuba has survived U.S. economic sanctions and the fall of the Soviet Union.
I would not read to much into Cuba.
Just like the US declined during a era of cheap oil thus it was able to use cheap oil based equipment to keep production up. This tells us little about future production after world peak.
Cuba although itself had problems with oil supply it was in a world that did not.
Big difference when a country is having shortages and the world knows we are running low on oil.
I'd say watch Nepal and Bangladesh closely if you want to see a better example of what is in store for the world.
stuart, an altogether interesting and well though out piece of work. i would say that you have a good comprehension of petroleum reservoir engineering.
some things i would like to point out: it is not at all clear where the various relative permeability curves come from. the reason i bring this up is - a numerical simulation model produces a "history matched" kro/krw. the laboratory derived kro/krw data is only the starting point. kro/krw data are adjusted in the model to "history match" production data.
in general a single kro/krw curve does not adequately represent the entire field. the reason : permeability and porosity variations.
it does seem though that we are spinning our wheels here (absent reliable data)
The above post is a synopsis of what you will find in the entire petroleum engineering world... nothing I know is useful because everything varies.
Why are we spinning our wheels?? No one to date has tied the underlying physics of the process of waterflooding to the basic properties (viscosity, endpoint saturations, etc) of these fields. You think this is a waste of time and effort because "things vary"???
View all the useful petroleum engineering information that has been extracted from the Saleri and SPE papers over the course of the past 5 days and how basically the chapter on Ghawar in Twilight has been rewritten correctly. I know you learned something (probably alot) that you didn't know- I know I did- I am willing to admit it and I started the damn thing.
Where is SPE on this.... doesn't it anger you that people our talking in detail about the thing we know the most about without our input???.
One more thing- I have basically known this material (what Saleri said and what was in those SPE papers) for over 18 months and tied it together the 21% residual oil saturation and the Saleri Ain Dar/Shedgum reserve pie chart (he's talking about nearly 100% of the mobile oil volume as recovery!!!!) for a long time.
I waited for the right time to say anything about it the production drop is the bell.... Simmons brought Aramco out with twilight.... let's call them out again. Don't poo poo it now.
Fractional_Flow, Exactly! We may not know everything but we know one hell of a lot more about Saudi's ability to produce oil than do those folks who buy into those unbelievable proven reserve figures. And right now almost the whole damn world believes Saleri when he spouts those numbers and how many years they can go on producing at the rate they produced in 2004.
Someone needs to keep the pressure on. Simmons started it and we need to just keep pushing. The fact that Saudi is in decline will not be sprung upon the world overnight. People will buy into every excuse that they give as to why they are not producing 10 million barrels per day or more. And those excuses will just keep coming. But every new excuse brings on a little more doubt to their position and a little more credibility to our position.
Cassandra is about to become a believable prophet.
Ron Patterson
Amen. Brother.
Hello Fractional_Flow,
re: "...let's call them out again."
Would you have a strategy in mind?
And, assuming this is successful...then...?
Just as an aside, I'm also (just a little bit) curious about why you felt the necessity to wait for the drop. (Did you think you'd be dismissed?)
Does Simmons know this already and if so, what is he saying?
(I'm also curious who else...?)
Stuart, although it's been said many times earlier today, you did a fabulous job on this post.
Although I agree with many of the points in the thoughtful, cogent analyses done by yourself and others like Khebab, WT, etc., I do think there is something to the point made by kebu77 about politics being at least as important as geology.
When the decline comes, politics won't be able to do anything to stop it. But before that, and especially in the case of KSA and GWB, politics must play some role.
Price has to be the ultimate indicator of being post peak. So far the oil price is not indicating a huge problem, although certainly that could change quickly.
On the point of productivity per well which you so clearly made, is there not an alternative explanation as follows. The rig count in KSA has gone way up. We do not know for sure whether all the new wells are being produced at full bore or whether there is in fact a reserve capacity in some of these wells. In calculating the productivity per well, the ratio goes down if either the numerator (total production) goes down, or if the denominator (total wells) goes up. So in the case of the recent dip in your plot, perhaps the denominator has had a significant effect.
And speaking of political effects, is there there the possibility that KSA is keeping some reserve capacity as a favor to GWB, so that if the US bombs Iran, prices will be moderated with the extra KSA capacity coming online?
Part of the reason for putting foward these thoughts is that perhaps I am in denial and don't want to believe that we have hit peak. Ultimately though price has not indicated that we have reached the crisis. It is true though that when the price gives us that signal, it will be too late.
Piccolo said,
"Price has to be the ultimate indicator of being post peak. So far the oil price is not indicating a huge problem, although certainly that could change quickly."
Historically, price has been completely useless as an indicator. Note that inflation adjusted the oil price sank to a post war low within months of the then largest produceer in the world (U.S.) peak. (!) Note also that if we used price as indicator, we would have to assume that we reached peak in the late 1970's. (many people did assume that, although the fancy name "peak" was not commonly used....the CIA issued reports saying that age of cheap oil was over, and Jimmy Carter, basing his thinking on then current intelligence said "oil fields are drying up all over the world."
http://en.wikipedia.org/wiki/Image:Oil_Prices_1861_2006.jpg
When peak comes, price will be of no help in giving warning. It will happen, as did the U.S. peak, in very, fast fashion, although it may be denied for years afterward. It is hard to imagine now that big block Chevy's and 455 Oldsmobiles were still selling like crazy even past U.S. peak, and the "go go" sixties were in full swing right up to the moment of it.
Roger Conner Jr.
Remember, we are only one cubic mile from freedom
Roger,
Here's why I disagree with your view of price and peak...
Yergin, in his magnum opus, The Prize, says that the US informed its allies more than a year before the peak that it could no longer act as swing producer, the capacity just wasn't there. He says that they were shocked at the news.
So, the US had an inkling even though the situation was unprecedented.
The US peak occurred in an oil soaked world with no previous big peaks in the rear-view mirror. The world peak will not. The fact that a lot more effort is required to extract oil has registered with all the global players and prices already reflect that.
My view is that price action will be very important and will tend to turn the peak into a plateau.
US Peak: local supply constraints, global abundance
World Peak: global supply constraints, global scarcity
Price action will be very different.
Hi Asebius,
Interesting comment (as are all the rest, enough said.)
re: "Price action will be very different."
Something I wonder...is it already "different"? What is the role of debt and deficit(s) in all this? It's not directly tied to oil price, yet is it tied? It seems it must be (at least in some way.) I wonder if it's possible to look at this is more detail, if, in fact, it holds.
Aniya,
I agree with you. Price movements are already different. And it's possible we are already on the plateau.
Long-dated futures contracts show people don't expect oil to fall. The normal thing in the past when oil prices surged higher, was for near-term prices to be high while longer term prices were lower. i.e. people reasoned -- correctly -- that supply difficulties would be cleared up and cheap oil would come down the pipe soon. Not anymore.
That fact alone will tend to put a damper on supply and demand. ie. Suppliers see higher prices going forward so they hold back on current production somewhat. Consumers don't see any relief in the future so subtle changes in consumption begin to be thinkable. This could lead to a plateau rather than a peak in production.
RE Debt. It's effect is sure to be rather complicated. If the borrowed money if being blown on current consumption, it will tend to raise prices now.
Asebius and Aniya: You guys may be onto something here. Where's an economist when you need one (someone who speaks calculus)?
Consider a model based on the observed behavior of poor countries already in demand destruction. Their imputed "deferred" purchase volumes may not be high, but how would the overall price curve have changed in the last year or two if poor countries had continued consumption trends of the preceding 2-3 years? (A change in the slope of the "poor country consumption curve" would determine the design of the model.)
I can't do it, but seeing how narrowing supply margins can boost price, I can imagine the higher price the model might show. It would be a leading indicator of what's in store for the rest of us as more wealthy countries are "cut in" to the demand destruction regime. Any takers out there?
_____________
Rex Tillerson doesn't buy green bananas.
Piccolo: Thanks for seconding the motion that folks add a little politics into the mix. I'm totally convinced from almost 4 years of following this that the peak production period (hesitate to say "year") is upon us, but I hear the concerns about not crying wolf too early, too specifically. The data fog is just too thick. I think I can argue more convincingly that politics plays at least an equal role with price in KSA's 2004 production increase. If true, ignoring it distorts the whole analysis.
There will be lots more politics and organized violance from here on out...
(Please note this is in no way a dismissal of Stuart's most excellent work.)
__________
Exxon-Mobil CEO Rex Tillerson says "the world’s oil would not run out in his lifetime". Means nothing... this guy doesn't buy green bananas.
Ah, TOD! Our glorious, interesting, educational, controversial and yes, very bipolar TOD! That last part is a little family secret among TOD followers, and this string is an absolutely perfect microcosm of how the ailment can kick in without warning, and the family has to weather yet one more episode, as any good family would do with a bipolar child....
The string begins with what is undoubtedly one of the best mathematical, technical attempts to understand and model a complex subject I have ever seen by Stuart Staniford. THIS is the stuff of a brilliant blog, more useful than almost any I can think of off the top of my head.
The issue is discussed by people who are fascinated by the very interesting and technical aspects as presented....and then....
The bipolar side kicks in.....within only a few posts, we are once again facing a starvation crisis, "Start thinking about how you are going to feed your family", riots in Saudi Arabia, office workers and college grads spending 10 and 20 hours per week in the fields attempting to grow food, according to one poster, something almost impossible to do without great education, a hostile government will defeat all efforts at individual or even group suvival (gee, if starvation was not enough, now my government is going to try to kill me!)
Finally, there was some attempt to get a grip, with ZPDM123 questioning a prior assumption: "That said, I need to call you on this quote. It is pretty darn dramatic to say oil exports from the major countries declined nearly one tenth last year. First off what are the assumptions you are making and secondly, put simply, where did we get the oil we burned last year?
This was the first attempt to stumble back from the bipolar episode, followed by a relapse...
"Peak Oil or the effects of it are like a rapidly spreading cancer by the time we see it in the US it will be too late to save the patient.", and
"I still don't know (and neither do you) whether we're in for mere recession and economic turbulence accompanied by gradual readjustment to a new paradigm.... or civilizational collapse." (gee, we only get too possible outcomes....interesting in a complex world...(?)
A little past half down the page, scroll wise, sanity starts to return, with the post by Flakmeister
"Stuart, superb article! I am still digesting the implications. It would appear that Ghawar will not fade at a continuous uniform rate and that we can expect sharp falloffs as each of the "independent" regions waters out. This will make the Saudi production curve very difficult to simulate.
(Interestingly, someone actually admitting that the picture out in from could be more complex than expected!! Sign of recovery....
And then, the more rational personality of our bipolar TOD returns, with rational discussion and for the most part, the scenario making personality, wild eyed and terrified, sinking into remission, with the last post I read before posting this one being elwoodelmore, saying of Stuart "you have a good comprehension of petroleum reservoir engineering" and
"it is not at all clear where the various relative permeability curves come from. the reason i bring this up is - a numerical simulation model produces a "history matched" kro/krw. the laboratory derived kro/krw data is only the starting point. kro/krw data are adjusted in the model to "history match" production data.
in general a single kro/krw curve does not adequately represent the entire field. the reason : permeability and porosity variations.
it does seem though that we are spinning our wheels here (absent reliable data)"
Ahhh, the ability to express doubt and rational thinking has at least returned for now, the certainty of terror and panic has subsided.....the other side of the bipolar personality has come back!! :-)
But, for how long? These attacks are always unpredictable, and come without warning. They create a panic stricken form of logic, unable to express any doubt, any rational ability to question. It is a tragic thing, and one we can hope for continual improvement from.
Of course, it goes without saying that when the disorder strikes, we must ask for any outsiders or newcomers to show sympathy, and not take what is said seriously. We ask for their indulgence until the disorder passes.
After all, even though suffering from what can be a serious disorder, we still love our dear bipolar TOD!
Roger Conner Jr.
Remember, we are only one cubic mile from freedom
The problem is at its heart peak oil is a social problem not a resource problem.
You may laugh but I assure you when a dirt poor Nigerian learns the the USA has burned most of the worlds oil he will not be laughing.
I think if anything we really don't understand whats going to happen. The emotion fear exists for a reason. Should we be fearful yes should we be irrational no.
One reason peak oil is even a issue is simply because the powerful people that know more than we do followed the result to its natural conclusion and let fear drive their decisions instead of acting rationally. And the more we are able to piece together the more I realize that the top people in our worlds governments must have good information on the problem presented from a number of points of view.
Considering its fairly easy to work through the implications of peak oil on the world not the wealthy countries the lack of action or at least public discussion is despicable.
Whats going to happen in Bangladesh when propane triples or worse in price ?
Read Stuarts post and read this.
http://www.thedailystar.net/2007/03/25/d7032501085.htm
Fear is healthy right now and action rational is even more important. Do you see a major problem brewing ?
Consider this quote.
http://news.bbc.co.uk/2/hi/business/6496943.stm
A bit more ominous after Stuarts post. The problems of peak oil are here now. What about when the PA has to spend half of its meager budget on energy ?
What about Hezbollah social services program when fuel is scarce and expensive for the very poor ?
I assure you the crackpots and political activists on all sides will use expensive and scarce fuel to push their agendas.
Since facts support the concept that America stole the worlds oil don't expect the cost of gas for the SUV to be the biggest issue we will face.
memmel asks,
"Do you see a major problem brewing ?"
I don't know if that question is aimed at me, but,
Short answer: YES.
Now, do I see the collapse of civilization, and rampent starvation in the developed world? Well, anything is possible, but at this moment I would need more facts than I have seen.
NOW, let's make it interesting: Let us assume that Saudi Arabia has more oil than even they say they do.....Matt Simmons gives the number (by the Saudi's estimate) at approx. 260 billion barrels, maybe another 2.5 billion in the neutral zone. Simmons says, "if these numbers are real it means that Saudi Arabia's oil will last another 90 years at the current production rate of 8 to 9 million barrels per day." Note the Saudi's claim these are "proven" reserves, the most conservetive of catagories, not "probable" or "possible" but "proven".
Let's assume the Saudi's are right. Let's assume, for the sake of an interesting "thought" exercise, that they are telling the truth. Let's assume they have every drop they claim, and who knows, maybe a little more.
NOW, to re-ask your question: ""Do you see a major problem brewing ?"
Short answer: YES. But why? Wouldn't that be the answer to our wildest dreams? We could buy all the oil we could burn, drillers would make money, refiners would have a near century of work refining....it would be 1965 all over again! Heaven!
But we know that U.S. production is declining. We know that European production in the North Sea is declining. We know that Chinese, American, and Indian consumption is climbing. Even with no peak, this is putting upward pressure on prices. The U.S. balance of trade situation is worsening, and we have not even began the mass importation of natural gas by LNG that everyone agrees will be needed soon, and much of which will come from OPEC Persian Gulf countries. The OPEC nations are embarking on a massive and expensive effort to build a petrochemical industry, able to ship fertilizer, gasoline, Diesel, GTL, and other petrochemical finished goods (by the way, does this sound like an investment you would make if you did not have available raw material to put in the plants and refineries?)
Oh have we forgotten anything? Well, just the greenhouse gas carbon emissions that will come from burning 260 billion barrels of oil.....oh, and the military/geopolitical implications of having to be the "hired guns" to protect the oil industry and supply chain (this with an aging demographic that can't provide enough troops now....how hard will it be in 10 years....15 years?
So YES, I see a major problem brewing. And all the Saudi oil in the world won't fix it, no matter how much they have. The inverse of Saudi Peak is at least as worrisome as Saudi Peak. The only reason we care about when Saudi Arabia peaks is for our investment plans, because whether they are near peak or not, our national situation is not very good unless we make massive changes away from fossil fuel consumption NOW. Selling the need for mitigation on the premise of "immediate peak" has always been an error.
Peak or no peak, we have to pay the piper and make the change. The carbon age must come to an end, either way
I now return you to your regular programming...
Roger Conner Jr.
Remember, we are only one cubic mile from freedom
Hi
I am the guy who asked the top question leasding us in into the "societal response bifurcation". I did that to avoid a war on HL or a mbpd here or there, as we have had on TOD the last weeks.
I dont see "me vs. the experts" as a, what did you say, splt in two. We are the same coin. The split at TOD are the threads with endless discusssions on small points, which are of academic importance (example HL).
Then you got a question from Memmel "do you see a problem". I cannot really understand your answer above. Can you give it a second shot now or later, please?
1) you state that what I asked for is a waste of time?
2) when you are confronted with "do you see a problem yourself" you dont answer?
3) from the long answer above I understand that you write, actually YES. So whats the problem?
4) you seem to be interested in the same questions as me, but just dont have the balls to really believe what your intuition is telling you (a 2nd time?). Am I right with my psychology 101?
5) you seem to say that saudi can flood the market. so world drops from 75mbpd to 70 and saudi increases from 8.5 to 12 over ten years? sum is null-null? so we have peak oil, an undulating plateau. so we are in trouble. Is this what you are saying, or do I read your post wrong?
6) in that case we agree, and what youwrite above is exactly the questions that I like to ponder about.
Thanks for reading!
TIIO(Thats....),
"Regular programming,regular programming..."
OK. Fine. We are starting to believe that the big kahuna is landed. The big enchilada has been cooked.
Then everyone's burning question is 'What the F**K do we do now??'
And we come up with basically *El Zippo*, except for some lame ideas on photovoltaics ,add a bit more insulation to yer house,and everyone walking to work.
We moan, we bite our nails, we drink whiskey,we make doomsday projections BUT we can go no further with a website that is titled TOD and speaks to deciding when the endtimes will appear.Its good,its good, for sure BUT the question still is.......
By the time its too late this website and the net will be history. As cell towers deactivate , more communicitations are lost. As the grid falters we now live pretty much in the dark with guns resting on our laps and with sore backs from bending over in the garden patch day after day and trying to shoot a squirrel or rabbit to gnaw on.
Far, far, far too late we realize. We shoulda done more to get ready. We knew it and talked about it endlessly but we really did nothing,,just talked.
Clue: If you don't have that piece of land or very good plans to shortly find a spot to weather it all out then its looking like you might never do it. Welcome to the end times then. Having to get out and take it with violence is not that easy. This is a country armed to the teeth and very concerned about property rights. Try facing a pissed off farmer Brown with his armed cronies and networked posse.
Ammo will cease to be available to many then its clubs and knives afterwards and it gets bad soon enough.
All the above?: I pray to the Sky God that its does not come to be..but something I saw in the fall of 1973 tells me it will be just like that. Taking 4 hours to travel 12 miles and wrecking a very nice 1971 VW due to chaos on the interstate and streets. Something tells me that was just a preview.
Again this is way way OT but its the end of the thread and we are talking about the end of our short,fast,happy go lucky,hippie/yippie,rockandrolled,discoed,heavymetal,drugged,
yuppie lifestyle about to disappear down the fabled rabbit hole.
Airdale-Class of '57 Graduation Guest Speaker?
ya never spoke to us about this
P.S. It was all some yammer about 'the key to your success is...yada yada ..'
Reality? Tomorrow try to get the onions planted. Pray for some rain. Buy some more coal oil and lamp wicks. A hundred more boxes of Strike Anywhere matches.Check in with the ones who network and get a few more transceivers going.Buy some more reloading powder and primers and find my old Boy Scout compass. Get another pair of RedWing hightops.
P.P.S. Is Airdale worried? I haven't had a good nights sleep in months.Its 3:30 AM right now. "Do you know where your kids are?" My kids? Living the yuppie life and sleeping well. Soft pink hands having known not the ass end of a mule and a single bottom walking plow.
"Is Airdale worried? I haven't had a good nights sleep in months."
O.K., if your going to go all worried on me, I will do something I don't normally do, and give you the solution, the whole thing, straight out...just between you and me, o.k.? It was actually so simple all along....
http://www.boogerballs.com/Citroen_2CV.jpg
Everybody in these, and no one has to look at the ass end of a mule....:-)
Roger Conner Jr.
Remember, we are only one cubic mile from freedom
Well,it looks like the final data is in,now,what does the one-eyed man do in the land of the blind?I have been following peak for 5-6 years now,and there was always the possibility that the numbers were off..or someone is being alarmist.Now its out.We are going to hit the wall at 110mph[ and brakes?we dont need no stinkin brakes]
I truely in my heart of hearts did not think TPTB would play it like this.I did not understand that the established order would see it in their best interest to continue our full tilt advance into oblivion.
Must not scare the public. We must continue our "happy motoring" lifestyle as Kunsler puts it.Keep the public buying Hummers.Must keep throwing up poorly built sub-divisions,financed with "ninja" financeing[NoIncome NoJob&assets]
Our payback for allowing ourselfs to be seduced by low monthly payments,and dont worry,be happy lifestyle will be biblical
I am doing what a person can do,with gardens and preparations such as one can make for a major change in life,but what burns me is that it did not have to be the way it will be....I mean as grim
We could have changed it rationaly.Our world is going to change,but we will have lost the control of the change that will occur.Probably forever.
Roger: Great post.
I quite agree, memmel - it is a social problem. And it seems that TPTB are being careful NOT to anticipate this problem, so that when some poor people somewhere have their demand destroyed, everyone can blame "the market."
"The people have a right to the truth."
Thank you Stuart.Alot
Roger,It might be due to the reaction that most folks have to getting sucker punched by one of the most readible,and concise analisis of "our likely collective doom"
Perhaps a whizbang gizmo,long surppressed,will be
brought to the table that will provide all the energy our
current technocivilzation needs to continue its roar into a bright,wonderful future.
I don't think so
Being rational about the timeframe needed to prepare for major lifestyle changes,if one is to live in the future we all see.Not bi-polar.Realistic.
You realize, of course, that both sides of a bipolar personality are dysfunctional. One pathologically optimistic, one pathologically depressed.
I've known bipolar folks that rarely experienced the south pole. Try anything, you couldn't keep those folks on their medication.
Actually, there is some dispute about that, at least in terms of 'productivity' in terms of artistic/creative output. It seems more a question of the extremes that the up side takes than the obvious difficulties of the down side.
However, this is not exactly a debate which works on a quantifiable basis - my great work of art may be your boring waste of time, for example.
It is also one reason, at least in the past, why lithium (not too familiar with the current crop of higher priced medications with patent protection, which seem to at least avoid the problem of fine tremors, though the new ones seem to have a notably increased rate of suicide when stopped - and no, this is second hand knowledge) was often discontinued by the patient - the up side was prized more than the down side was despised.
Obviously, a truly manic state is untenable - standard practice in the 1980s for someone babbling rapidly/incoherently/disjointedly was to sedate them for about 2 weeks while also administering lithium, and then end the sedation for a few days - if the person appeared fairly normal, they were manic/depressive and thus 'cured' (lithium is very inexpensive, except for monitoring blood levels). If they were still in roughly they same state, they were schizophrenic. (This is close to the only 'public health' pychiatric practice I actually find acceptable in terms of dealing with individuals.)
Roger,
As this wasn't in a thread I was writing on, just noticed you mentioned me. As the cowardly lion said in the Wizard of Oz, "Aw Shucks folks".
You know occasionally it is crystalnacht or D-day or Hurricane Katrina, just not very often and usually not seen by people before hand. The positions on TOD remain, at the present, in the minority. As an outsider, I am disturbed by the number of intelligent, experienced people, as seen in this discussion who show up to debate this issue. That itself leads me to take it seriously. While any glance at a full parking lot leads one to the idea that PO if true leads to serious consequences I find the Olduvai gorge crowd quite hyperbolic. If people are hungry, no red tape, I imagine we could build 50 nuclear reactors in this country in a year. I think that's a bad idea, but just to say oil isn't a magic elixir, it is a long chain hydrocarbon created in nature as a storage medium for very abundant radiant energy.
Now to stick my neck out a bit. 2007 will tell us a lot. Despite how PO people put it, there is an unacknowledged working hypothesis that in 2007 production will be unable to meet demand. If this doesn't happen we are in a situation that Ralph Rapier wished to avoid of being overly concerned about a problem that is still real, though still a bit distant. However, I think, given the current progress in AE, five years of peace and prosperity and PO is much less serious an issue.
If 2007 declares PO a big issue we just have to hope it is not declared with a thud as, to put words in his mouth, it seems WT and others might feel. Personally I think 2007 is more of an investment sort of year, not that I am good at this or advising this, still, it is 2008 that concerns me.
For a country that has obesity as one of its primary health concerns how would we react to continued loss of oil supply. There is a slim hope that we would transition to more local, healthy, and sustainable societies. Accepting PO it might not seem likely but it seems where hope lies.
I think much of the angst on this board doesn't directly relate to PO, it relates to something undefined that is wrong, and unsustainable, with current society. If we are extremely fortunate PO is the catalyst which also addresses these issues
Great post Stuart.
Robert, are you still reading? I would value your feedback. If this seems logical to you and Euan, then there would be little doubt in my mind that KSA has peaked.
He has some comments on his own blog. Not a detailed response, sounds like he's not persuaded yet, but nonetheless describes this as a "compelling case".
Robert's fundamental problem is that he wants to believe the KSA inflated reserve statements. If we remove the inflated reserves and count up total production of KSA to date, then anyone can see they are near or past peak. The only reason this debate exists is because of the inflated KSA reserve statements, which are questionable as others have noted (including yourself).
Robert has faith in those KSA reserve numbers. Robert wants to believe what KSA tells us when production declines. Heck, even several of the other contributors here at The Oil Drum want to believe those KSA numbers.
I find it more than a little humorous that his entire position is predicated upon belief in inflated reserve numbers yet he chastises others for belief in anything else.
Let's review real fast, shall we? According to the EIA itself, KSA has produced from 1960 to 2005 an astonishing 101 billion barrels of oil. This does not include pre-1960 production!
Further, we note that OOIP estimates for KSA were around 170 GB. Given the production number above plus the OOIP numbers, it's fairly obvious that KSA has passed peak. The only way to believe that KSA is not at peak is to accept their inflated reserve numbers - reserves which have not dwindled one iota despite nearly 20 years of reporting 260 billion barrels or reserves yet steady production of 2-3 billion barrels per year. Reserve numbers that leaped up by 90 billion barrels without any corresponding discovery. Reserve numbers that leaped upward in tandem with OPEC's decision to base quota on reserves.
I don't know whether to laugh or to cry here. But someone is doing some really heavy mystical unscientific believing and it's not me.
Ghawar Is Dying
The greatest shortcoming of the human race is our inability to understand the exponential function. - Dr. Albert Bartlett
Many of us believe what we want to believe. A candidate for president who acknowledged a lack of belief in a higher being has no chance of being elected, I suppose because those trying desperately to believe that something good will happen some day must have leaders who believe something similar, otherwise said belief might be challenged.
PO is not much different. PO implies substantial changes, none for the better, and making all other existing problems worse. PO in 30 years is barely ok, po in 3 years is simply unacceptable (because it affects us instead of our kids), along with our not-negotiable life style.
OOIP in Saudi Arabia is at least 600gb (ASPO estimate) and Aramco claims the best estimate has grown to 700gb. It's not so unreasonable that they are going to recover 60% in 'Ain Dar (everything goes green). So with the 600gb ASPO estimate and if everything else was as good as 'Ain Dar, then final recovery would be 360gb, with cumulative to date being 120ish, leaving about 240gb to go. However, everything else is rather unlikely to be anywhere near as good as 'Ain Dar, so it's probably quite a bit less than that. I don't see that we have a basis for a quantitative estimate, however.
Mea culpa. The 170 GB figure was not OOIP but the remaining reported recoverable fraction of OOIP, as stated by Campbell.
Ghawar Is Dying
The greatest shortcoming of the human race is our inability to understand the exponential function. - Dr. Albert Bartlett
I think that the original Aramco estimate, in the Seventies, for URR for Saudi Arabia was about 170 Gb.
Interestingly enough, this is almost exactly between my revised low case and high case HL estimates.
Low Case (Ignore the recent deflection): 150 Gb
High Case (Honor the recent deflection): 186 Gb.
Midpoint: 168 Gb.
IMO, given the strong evidence of an involuntary decline in Saudi production, it is very likely that the URR is between 150 and 186 Gb.
re: Iraq oil possible diversion via KSA...A key question seems to be: Is the IPSA pipeline from Iraq into KSA really not in service? Really? and does anyone have any skinny on this?
Thank you Stuart;
One of the finest posts and ensuing set of contributions from all TODers I've ever seen. Some new helpful 'insiders' too. Anyone needing to know the value of this site need only follow this thread.
The mitigation start clock has been running since the cartigan sweater days of Jimmy Carter. It looks like the alarm is about to go off.
re IPSA pipeline..."On June 11, 2001, Saudi Arabia announced (in a letter to UN Secretary General Kofi Annan) that it was taking ownership of Iraq's pipeline to the Saudi Red Sea coast (closed since August 1990), saying that Iraq's behavior had "destroyed any rationale for maintaining the [pipeline] facilities."[from eia.doe.gov]
Anyone know if this pipeline shut or returned to service?
.
Hi Stuart,
Congratulations on your extremely thorough analysis!
Here is a forecast of Saudi’s crude oil & lease condensate production. I really hope that I am wrong and that Saudi Arabia can produce more than my forecast.
However, even if they can produce more C&C up to the end of 2011, Saudi only has Manifa phases 2 & 3 for post 2011. What other projects does Saudi have left to develop?
It seems that Matt Simmons’ answer to this question is that there are no other big projects left to develop in Saudi Arabia after Manifa.
http://www.simmonsco-intl.com/files/Coloardo%20College%20March%205%20to%...
Slide 23 is not encouraging:
Some links for the sources containing data on the forecast Saudi Arabia projects are:
Chris Skrebowski’s Megaprojects Database
http://www.odac-info.org/bulletin/documents/MegaProjects_Feb2007.pdf
OPEC’s Saudi Arabia upstream projects
http://www.opec.org/home/PowerPoint/Supply%20and%20Capacity/upstream%20p...
Saudi Arabia’s Strategic Energy Initiative: Safeguarding Against Supply Disruptions
Nawaf Obaid
http://www.csis.org/media/csis/events/061109_saudi_presentation.pdf
According to sa, output was down to around 8.5mb/d feb.
IMO your overall production decline rate is much too low following the date of each new project initiation... while I think the slope becomes more gradual, you show a marked change with the first new project. Perhaps you have khurais about right, the ramp up allowing a modest expansion over the period. Putting it differently, the total expansions of 2.5Mb/d come on line over a four year period, and the current decline rate is 1Mb/d/y... even if the decline rate is flattening, it seems likely that production mid 2011 will be lower than current 8.5Mb/d. IMO, sa will not avg 8.5Mb/d over any twelve month period following 1/1/08.
And, all projecitons assume all announced new projects come on line when and at the rate announced.
In support of Roger who mentioned the global warming issue even if there were sufficient oil supplies. I have posted this before but I have to repeat it here:
Scientist predicts disastrous sea level rise
http://www.abc.net.au/7.30/content/2007/s1870955.htm
DR JAMES HANSEN, NASA CLIMATOLOGIST:
.....If we get warming of two or three degrees Celsius, then I would expect that both West Antarctica and parts of Greenland would end up in the ocean, and the last time we had an ice sheet disintegrate, sea level went up at a rate of 5 metres in a century, or one metre every 20 years.
That is a real disaster, and that's what we have to avoid....
KERRY O'BRIEN (ABC TV): You said just a couple of weeks ago that there should be a moratorium on building coal fired power plants until the technology to capture and sequester carbon dioxide emissions is available. But you must know that that's politically unacceptable in many countries China, America, Australia for that matter, because of coal industry jobs and impact on the economy.
JAMES HANSEN: Well, it's going to be realized within the next 10 years or so that we have no choice. We're going to have to bulldoze the old style coal fired power plants. We can burn coal, provided we capture the CO2 and sequester it, and we're working on technology that would allow
us to do that and we should have been working a little harder but, nevertheless, we will have, within five to 10 years, we will have that technology. In the meantime, we should be emphasizing energy efficiency so that we don't need new old style coal fired power plants. We're just
not doing that.
James proposes a fail safe sequestration of CO2 in deep ocean sediments. Who would like to have a CO2 dump in their backyard after we have seen how 1,000s of people died in Cameroon from a bursting CO2 bubble in mountain lake Nyos:
http://news.bbc.co.uk/onthisday/hi/dates/stories/august/21/newsid_338000...
We in TOD know the second half of oil and gas will require a dramatic increase in drilling rigs just to reduce steep decline rates. So where will all the drilling rigs come from to do that deep ocean sequestration of CO2, at a gigantic scale all around the world? Stark choices will have to be made.
In Australia, governments started to dream of "clean coal". These are all distractions. We are critically wasting time to go full speed into solar, wind and other renewables. If we don't do this, we will not only wreck our climate for good but also fall down the energy ladder. At a peak oil conference in Scotland 2 years ago they called it 'energy winter".
Of course, the issue of sea level rises applies not only to coal but to all carbon based fuels.
Sorry, but irrespective of whether deep ocean sequestration is a good thing or not, that's just plain alarmist. The deep ocean contains an immense amount of dissolved CO2. The amount we'd add by sequestration would be very small (we've added about 215 Gtons C to the atmosphere since 1850: if all of that were sequestered in the deep sea that would add less than 1% to the 38000 Gtons already there) If the deep ocean were somehow to turn over we're done, sequestration or no. Actually, the event that's big enough to turn over the deep ocean would get us before the carbon would.
First it wont be distributed evenly so you would expect very high local concentrations depending on currents.
Next the one place we do not understand is the deep ocean its the last frontier on earth. I hesitate to assume we can make any assumptions about how we would effect it.
In general marine life tends to be finely tuned to its environment esp. the lower life forms. So the effects of any changes are really unknown. If we have been thinking we should have started experiments a long time ago to get a handle on this. We did not. We could have easily done them in the 1950's and have fifty years of data collected.
Not saying it's a good idea. I am saying that turning over the deep ocean to get a Nyos-like CO2 burp would require tectonic activity on a scale that would render all of our other problems moot. And because CO2 solubility increases dramatically with increasing P and decreasing T, there is already far more DIC (dissolved inorganic carbon in the literature, bicarbonate to everyone else) in the deep ocean than there is CO2 in the atmosphere.
Ohh :)
That idea is so stupid its not worth commenting on.
Sometimes I think the press should at least explain that after they publish hair brained statements.
May I say that it is very rewarding to see such an excellent article being peer reviewed by Euwan on the same page. This intelligent discussion gives balance to the argument and allows the reader to make an informed judgement as to which side of the fence they are on. Thank you.
The point about CO2 escaping and killing people was that the potential for CO2 dumps onshore will be quite limited. That's why Hansen proposes the deep ocean sediments which would favour power plants along the coast. Longe pipelines would be needed to carry CO2 from coal fired power stations inland. Where - after peak oil - is the diesel for these huge civil works?
I think this debate is valuable in that it shows how difficult if not impossible some of these "clean coal" solutions are and that we better go for renewables immediately otherwise we just waste precious time.
I am new to this forum because a professional colleague pointed me to this article. This will be my first and last post because I know my comments will not convince the true believers among you. I've learned over the years that arguing with peakists is like arguing with religious fundamentalists of any stripe over the truthfulness of their faith.
First, a word upfront on my qualifications. I have spent close to 30 years in the oil industry, with many years working in Saudi Aramco during which I gained intimate knowledge of the key Saudi oil producing oilfields. So I think I have a perspective on this debate that has so far been lacking.
Put bluntly, Mr. Staniford's article is fluff masquerading as sound analysis. It uses information on Saudi oilfields in a highly selective fashion that is used to support the underlying faith-based premise that the Saudi oilfields are peaking. Unfortunately, this is true of most everything I have seen from the peakists when they try to justify their worldview.
This is not to say I agree with CERA's or EIA's rosy view of global oil supply growth in the next 10-15 years. There are limits to how much oil the Saudis will be able to produce in the future and under no foreseeable circumstances do I envision the Saudi oilfields from being able to sustain production of 20 million bpd or more as implied by some of EIA's long-term forecasts. The only reason I qualify that statement with "foreseeable circumstances" is that I cannot entirely rule out the possibility the technology advances in oil recovery technology or additional oil discoveries in Saudi Arabia.
I also must say that Matt Simmons, who some peakists revere as if he is a great authority on the issue of Saudi oil because of his book "Twilight in the Desert", is ill-informed. He is someone who spent all of 2 or 3 days in his entire lifetime in Saudi Arabia and read some 200 SPE papers on Saudi oilfields, some of which date to the 1960s. Matt is a very nice and sincere person, but he does not know what he is talking about when it comes to Saudi oilfields. To use an analogy, I'm sure I could find and read 200 articles in top-flight medical journals on brain surgery, but that would not qualify me as a brain surgeon and you would not want me probing around your brain with a scalpel. Matt has made a lot of money spreading his misinformation on Saudi Arabia, much to my chagrin.
In closing, I'm sure my post will get slammed by many of you in this forum, but I'm not interested in an extended debate with people who are absolutely convinced of their position despite little direct knowledge of the subject.
DhahranOilGuy
What a ridiculous post. Certainly the pot calling the kettle black when it comes to faith based argumentation.