| Using NATO to fight peak gas | The Oil Drum: Europe | Will Nuclear Fusion Fill the Gap Left by Peak Oil? |
A primer on reserve growth - Part 3 of 3
Posted by Rembrandt on January 8, 2007 - 11:35am in The Oil Drum: Europe
Will 730 billion barrels be added to the reserve pool from reserve growth between 1996 and 2025 as estimated by the United States Geological Survey?
This post is the third part in a three piece series about the phenomenon of reserve growth in found oil fields. Insight in future reserve growth, often attributed to technological advancement, is crucial in determining the peak of conventional oil production. For those not familiar with reserve growth, it would be best to read part 1 first:
What we learned in part 2 of this series is that the data with respect to reserve growth is utterly confusing. Nonetheless, we need an answer to the question what the future perspectives are for reserve growth in order to; 1) improve forecasting the peak in conventional oil production; 2) Increase the understanding of the future role of technology in the oil industry.
The United States Geological Survey has so far been the only institute which has published an estimate for future reserve growth. In their World Petroleum Assessment from the year 2000 they estimated that reserves would grow with 730 billion barrels between 1996 and 2025.(612 billion barrels for conventional oil, 118 billion barrels for Natural Gas Liquids). By estimating past reserve growth in the US lower 48 a reserve growth algorithm was established. This algorithm of which the curve is shown below was then applied to the entire world. Delivering an estimate of 730 billion barrels.
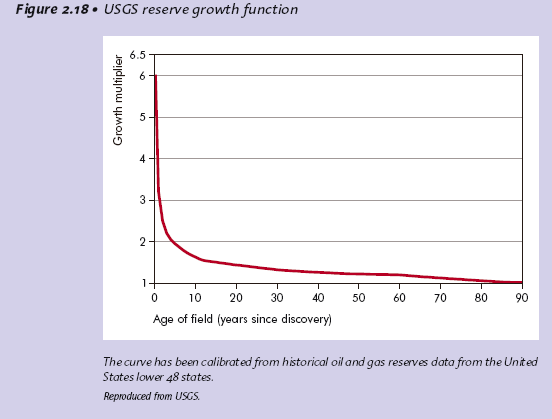
Chart 1 - Source: USGS, Verma
The problem with this method is the way how crude oil reserves are reported in the US which has been described in detail in part 2. Because of the practice of reporting only proven reserves, the amount of reserve growth is very high in the US when compared to other regions. In addition several heavy/extra heavy oil fields such as the kern river oil field are included in the assessment, which showed huge reserve growth due to the advancement in steam technology necessary to dilute the oil to produce it in the middle of the 20th century. It is erroneous to apply reserve growth in such heavy/extra heavy oil fields with medium and light crude oil fields. Thirdly applying onshore reserve growth to offshore and deepsea fields is certainly not an approach that gives a correct estimate. Based on these three issues, the figures presented by the USGS do not seem to have much value. The method used likely provides figures too inacurrate to be relied upon.
However, the USGS authors (Albrandt et al) have acknowledge a part of the problems outlined:
"There are several reasons why a reserve-growth function that is based on historical trends for oil and gas fields in the Lower 48 states could Overestimate world potential reserve growth:
Engineering criteria for reporting reserves of world oil and gas fields might, in general, be less restrictive than those for the United States, tending to increase known reserves and decrease the potential for reserve growth.
Reported reserves might be deliberatly overstated in some countries, reducing the potential for future reserve growth.
Large world oil and gas fields might tend to have more substantial development than U.S. fields prior to release of initial field-size estimates, leading to more accurate initial reserves estimates and reducing the potential for future reserve growth.(USGS WPA 2000, chapter AR)"
To see if these critical remarks on their study held any value the authors of the USGS study attempted to apply their function for reserve growth, as shown in graph 1, to other oil producing regions in the world. Several latter publications were published with respect to reserve growth in Volga-Ural (Verma et al., 2000), West Siberian Basin (Verma and Ulmishek 2003), the North Sea (Klett and Guatier 2003, 2005), the Middle East (Verma et al., 2004) and Canada (Beliveau, 2003; Verma and Henry, 2004). Their conclusion was that the reserve growth curve is indeed applicable to the entire world, given reserve growth patterns observed in these other regions. The one about Russia has been described in detail in part 2. These publications do not shed much light on the issue however as shown in part 2. Reserve growth varies in every region in the world. Applying a strict curve from one region towards others does not make much sense to me in the light of the highly chaotic variance in data. I therefore disagree that such a conclusion can be made, the USGS authors could be right, but they could also very well be wrong.
The International Energy Agency seems to disagree with this cautious vision on estimating reserve growth. In their recent resources to reserves report they noted the following about the USGS method and the criticism it received from ASPO:
"It should be noted that some authors (ASPO) argue that the "reserve growth" phenomenon is an artefact of very conservative United States reporting on proven reserves, which should not be applied worldwide, particularly in OPEC countries where some observers claim that published proven reserves numbers are suspicious (Simmons 2005). However, further studies by USGS geologists have pointed to reserve growth observed also in large fields outside the United States, at a rate consistent with the assumption of the 2000 Assessment (Klett 2003)." (IEA Resources to Reserves, 2006)
There is only one way to give a reasonable answer to what future path there is for reserve growth. The USGS takes the estimates from the IHS energy database (formerly petroconsultants) as a starting point. The updates in the IHS energy database therefore give excellent means for reviewing the forecast from the USGS. By looking at every change in the past decades in the IHS Energy database (formerly Petroconsultants) in meticulous detail an accurate answer can be found. Only then we will know what exactly bas happened in the past decades with oil reserves (proven and probable). There is only one problem, access to the database costs approximately 1 million dollars a year, a bit too expensive for a voluntary weblog. So the best we can do at the moment is by looking at the bigger trends that are available in public domain data.
In a publication from August 2005 in AAPG Bulletin (An evaluation of the USGS WPA 2000) the authors (Albrandt et al) conclude that approximately 28% percent or 171 billion barrels of the forecasted 612 billion barrels for conventional oil had been added to the reserve pool between 1996 and 2003.
In a presentation from 2004 one of the UGSS study authors (Klett) showed a graph depicting reserve growth in giant oil fields between 1981 and 1996 and 1996 and 2003:
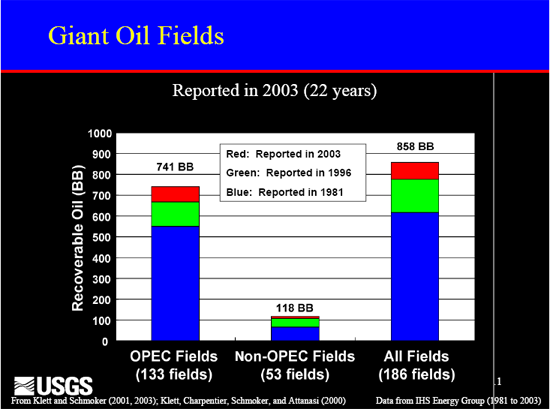
Chart 2 - Source: USGS, Klett
It is important to note that the largest part of the change occured in giant oil fields operated by the OPEC cartel. The USGS notes that 73 of the 171 billion barrels of reserve growth came from giant fields in OPEC countries. From a chart in a paper by Ahlbrandt (USGS WPA 2000 main author) in the "book Oil in the 21st century" the division between the 171 billion barrels figure for reserve growth between 1996 and 2003 can be estimated (approximates):
83 billion barrels (Middle East and North Africa)
36 billion barrels (Central and South America)
18 billion barrels (Former Soviet Union)
13 billion barrels (Sub Saharan Africa)
12 billion barrels (North America)
5 billion barrels (Europe)
3 billion barrels (Asia Pacific)
1 billion barrels (South Asia)
The reserve growth phenomenon is also tracked by IHS Energy, whom present a much larger number than the USGS with respect to reserve growth in the period between 1995 and 2003 (457 billion barrels). The large variance in figures presented is to say the least, puzzling. The most likely explanation is a difference in definitions. The USGS could for instance only have include additional proven reserves while IHS Energy included proven + probable reserves. Nonetheless they both agree that the largest part of reserve growth between 1995 and 2003 was observed in the Middle East:
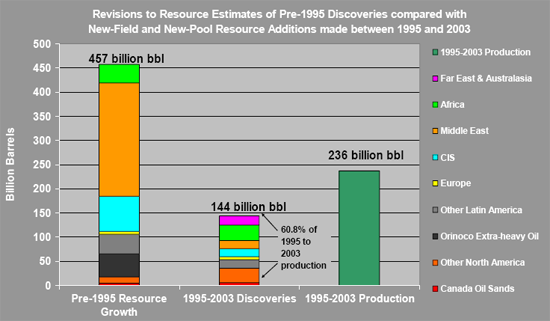
Chart 3 - Source: IHS Energy
In the period between 1995 and 2003 nearly 250 billion barrels were added to fields in the Middle East in the IHS Energy database. In this period almost no conventional oil was discovered in the same region. Given the secrecy of Middle East reserve forecasts, it is questionable that these reserve additions are real. In addition Jean Laherrère notes that in 2004 another large reserve increase occured in the Middle East in the IHS Energy database. (Laherrère, 2006, pag. 19).
The effect of reserve growth on reserve estimates over time is shown very clearly in a graph from Francis Harper from BP:
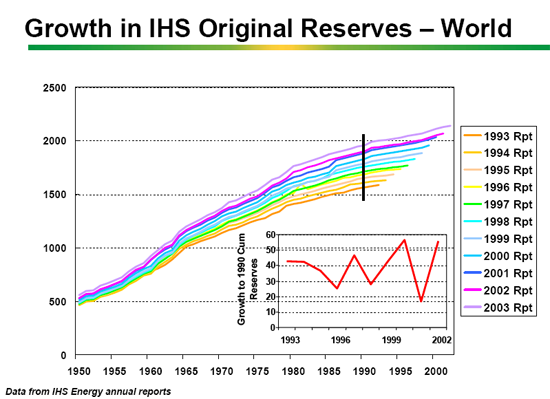
Chart 4 - Source: Francis Harper, BP, reserve growth in this chart is not backdated to original discovery as is common practice in reserve estimates made by ASPO.
Since I have no additional information with respect to the value noted by the USGS on reserve growth (171 billion barrels), we take a further look at the changes stated by IHS Energy (457 billion barrels)The difference between the USGS figure from the IHS database and the figure from IHS Energy is explained in a presentation by Peter Stark (Vice President IHS Energy):
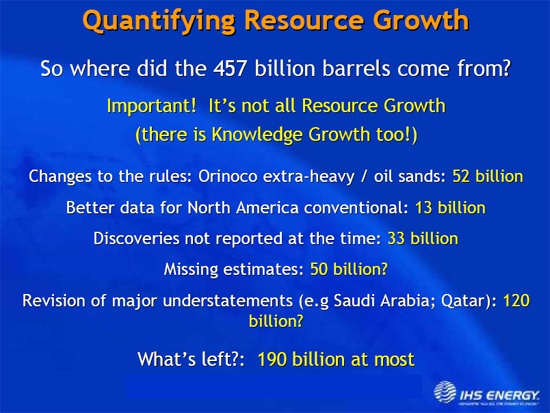
Chart 5 - Source: IHS Energy
The revisions that IHS made shown in the chart above explain the largest part of the reserve growth phenomenon. 96 billion barrels can be discounted because of missing data. An additional 52 billion barrels can be discounted because of changes in the rules. That leaves 309 billion barrels of reserve growth in the period between 1995 and 2003. Of these possibly 120 billion barrels according to IHS are due to underestimates in the Middle East. The question that remains is where the remaining 190 billion barrels of reserve growth as noted by IHS energy comes from. The largest part of this increase comes from the Middle East, given the increase in reserves from pre-1995 discoveries of approximately 250 billion barrels between 1995 and 2030.
So basically we are left with two choices:
1)If we think that the 190 billion barrels can be attributed to genuine reserve growth, the USGS estimate of an addition of 730 billion barrels from reserve growth between 1995 and 2025 is on track so far. This does not necessarily mean that reserve growth will continue or discontinue to happen in the future as it did in the past.
2)If we think that the 190 billion barrels are not caused by reserve growth but mainly by political overstated reserves in the Middle East, then we can throw the USGS estimate in the garbage can. Reserve growth will be far lower then now accounted for and forecasting publications that rely on the USGS estimate are too optimistic (IEA and EIA forecasts).
As to the lastest figures from IHS, 2005 was a very bad year for reserve growth. Only 8 billion barrels were added from pre-2005 discoveries in the IHS Energy database in 2005. Production in 2005 was larger then reserve growth and discoveries combined in the IHS Energy database, leading to a net decline in reserves:
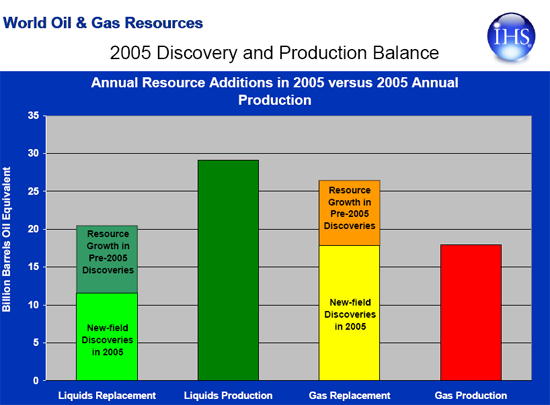
Chart 6 - Source: IHS Energy
Personnel
Editors
Contributors
Peak Oil Primers
Archives
- November 2010 (3)
- October 2010 (6)
- September 2010 (4)
- August 2010 (7)
- July 2010 (6)
- June 2010 (7)
- May 2010 (2)
- April 2010 (8)
- March 2010 (4)
- February 2010 (6)
- January 2010 (3)
- December 2009 (5)
- November 2009 (8)
- October 2009 (12)
- September 2009 (6)
- August 2009 (5)
- July 2009 (11)
- June 2009 (8)
- May 2009 (16)
- April 2009 (10)
- March 2009 (7)
- February 2009 (10)
- January 2009 (15)
- December 2008 (9)
- November 2008 (9)
- October 2008 (9)
- September 2008 (13)
- August 2008 (10)
- July 2008 (14)
- June 2008 (23)
- May 2008 (16)
- April 2008 (12)
- March 2008 (16)
- February 2008 (9)
- January 2008 (13)
- December 2007 (13)
- November 2007 (16)
- October 2007 (22)
- September 2007 (8)
- August 2007 (9)
- July 2007 (16)
- June 2007 (8)
- May 2007 (7)
- April 2007 (7)
- March 2007 (10)
- February 2007 (10)
- January 2007 (12)
- December 2006 (9)
- November 2006 (15)
- October 2006 (4)
- September 2006 (5)
- August 2006 (5)
- July 2006 (9)
- June 2006 (5)
- May 2006 (10)
- April 2006 (9)
- March 2006 (13)
Vital Trivia
License

This work is licensed under a Creative Commons Attribution-Share Alike 3.0 United States License.
"If we think that the 190 billion barrels can be attributed to genuine reserve growth, the USGS estimate of an addition of 730 billion barrels from reserve growth between 1995 and 2025 is on track so far. This does not necessarily mean that reserve growth will continue or discontinue to happen in the future as it did in the past."
I concur. And the good news is that the rate of Reserve Growth is increasing. When i tracked the 18 URR Estimates for my study, i found that Reserve Growth including Discoveries averaged 48-Gb/annum. However, in this decade, we are seeing phenomonal Reserve Growth incl Discoveries of 140-Gb/yr.
Since we know Discoveries since Y2k have been minimal and that the technology for assessing fields is vastly improved, we can deduce that Price is the determining forcing agent. Plus $30/barrel pricing allows extraction of hundreds of fields that were deemed uneconomical. IEA presently determines that each $5 increase in the real price of oil will add about 100-Gb to global URR. The usgs study forecast that Reserve Growth would grow at 24-Gb/yr. But as we know from EIA Outlooks of the era, their premise was based on pricing regimes much less than we are seeing for this decade. The acceleration of real oil prices in the first decade of the new millenium has been the greatest factor in their underestimation of events.
On Jan 1st 1996 (effective date of usgs-2000), the global URR stood at 1720-Gb in my study. Today, global URR is 3010-Gb ... an increase of 118-Gb/yr.
Again, i caution that i have used Reserve Growth in a fashion that includes Discoveries. The Discovery portion, tiny component as it is, should be discounted for an accurate appraisal of their achivement of targets...
It is clear that usgs underestimated Reserve Growth and overestimated Discoveries. Another factor for discrepancies is that the usgs study assumed a URR of 3123-Gb for 1996. They were somewhat ahead of their time in defining reserves and resources as part of URR that conventional estimates only adopted later. In short, the USGS was counting discoveries and non-conventional oil already in 1996 that some estimates still today do not recognize. The concensus of URR Estimates is in 2007 just attaining the magnitude assumed by usgs for 1996. Today btw, the EIA assumes a URR of 4036-Gb, an increase of 83-Gb (incl Discoveries) since 1996. So, by almost every parameter, the USGS is on target.
The heavy blue line is URR:
please click link for legend and footnotes - http://trendlines.ca/urr.htm
What will be the average price of Nymex LSC in 2007? How much will crude production grow/shrink in 2007? From it's current base of 73/85. Or maybe it is 74/84, I forget. 1.5%, 1%, flat, or negative(decline).
Do you count 2006 as a flat year, or a declined year? I hope maybe Jerome on his DKos page or Prof. Goose will run a poll similar to this.
How many people read today's Bloomberg blurb on OPEC? How many people believe OPEC can function as a single entity? How many people think November and December production will be that different from October? Pemex's November numbers are out. They are not doing so badly. The price drop from August has to hurt, though. I think America, as in both North and South America should form a group. OPEC style. But for real. Anybody ever play RISK? Of course Hugo Chavez would cause problems. But not for long. Look what happened to Guzman and Sendero.
Right, Saudi oil reserves were way underestimated. Hell they are still underestimated, they say they have about 200 billion barrels yet to be discovered. That is in addition to the 260 billion barrels of already "proven" reserves. The whole damn country is just floating on oil.
And otherwise highly intelligent people really believe this stuff. It is enough to make a grown man cry.
Ron Patterson
The KSA has only recently developed fields that contain the second half of their P1, P2 & P3 Reserves & past Consumption of 462-Gb as described including their production plans last month. They have expressed their intention to develop 394-Gb of this by 2054. In 2007 and beyond, we will continue to see Hubbert Linearization models undergo realignment such that KSA's (all liquids) URR shifts from an indicated 197-Gb to 394-Gb. This is known affectionately as the Global and KSA dogleg (pre-revision graph credit to Euan Mearns) and will become more prominent as the decade progresses:


It is too early to assess the cumulative effect of similar latent fields opening, but Jean Laherrere (with two decades experience in linearizations) is already illustrating that the new regime indicates that (all liquids) URR has moved from 2250-Gb to 3100-Gb.
This bodes well for long term availability of oil globally, but is not an indicator that Peak Rate or Peak Date will be extended. It will likely only dampen the decline rate.
Freddy you cannot draw conclusions from a three year change in the curve....
Clearly, Jeffrey's use of HL is flawed. In both KSA & Globally, we can see that 2003, 2004 & 2005 indicate something new is afoot. 2006 extends that pattern in both jurisdictions. We can already see that 2007 cannot bring this new paradigm back to the norms. Using a calculator, any of us can see that KSA would have to drop to 8.4-mbd and globally we'd have to dip to 77-mbd from 86-mbd to get back to the old regime lines. And that ain't gonna happen. So we have in effect five years of HL new regime to consider.
I warned in October that inventories were bulging. The cutbacks were a natural reaction. Anybody who didn't believe it thru November and December has to look at last week's prices (now 22% below September) and ask when they will stop fooling themselves. Both EIA and IEA are showing surplus capacity at almost double that of a year ago.
Peak Oil got on the Iran bandwagon and piggybacked a ride to its 15 minutes of fame. The fear factor is evaporating before our eyes and the marketplace is returning to historic real norms.
There are 13 recognized Outlooks that tell us we are on our way to 90-mbd shortly after the inaugeration of the next usa President. There are NONE that defy that trend. There are no recognized URR Estimates that are showing a decline in annual URR. In fact, because they are consistent on Reserves, they are in effect going up 31-Gb/yr because they have chosen not to deduct last year's Consumption.
To defend a URR of 2086-Gb and a Peak in 2005 brings the level of debate to cult status. It is inconceibable that global production that has risen from 77-bd to 86-mbd in a mere 48 months is just going to roll over 'cuz of Jeffrey's misguided use of that same calculator. It is apparent from the list of folks who tell us supply is going up and the credentials or lack thereof of those on the very short list who say otherwise, that one camp is very wrong (again).
"There are 13 recognized Outlooks that tell us we are on our way to 90-mbd shortly after the inaugeration of the next usa President. There are NONE that defy that trend. There are no recognized URR Estimates that are showing a decline in annual URR."
Freddy, what is the current average of these outlooks regarding a peak date and maximum rate per day achieved?
95-mbd in 2020
Sounds a little high and far out, but not completely unreasonable. I wonder what the % of the total liquid that C+C will be?
I would assume it would be considerable smaller than it is today. Just read an article and it looks like the CTL push in the US may be starting.
You are basing this forecast of production on a few years trendlines that have seen the price of oil going up. What happens when the price of oil stagnates or declines over a year or two? Prices for new production and enhanced recovery are increasing at 25 to 50% per year in such places as Alberta tar sands. Probably same is true for KSA and deepwater Gulf of Mex. Then also consider that places like Iran and Mexico don't have the political will to increase production. And other places like Iraq and Nigeria are on the edge of civil war with factions fighting over who gets the benefits of oil.
Bottom line: IMO your forecast of 95 mbd is unlikely given economic considerations and political turmoil. Remember URR does not mean increased production, only that oil can be produced at a certain cost.
The reason for the fall in the price of oil is.
1. No storms in the gulf last year. (At the start of the year 06 you would have had trouble finding someone to take this bet).
2. Mild winter (almost no winter infact)Even without cold weather we are still getting thru our oil stocks. A normal winter and you would be looking at a much different price.
3. The market has learned to live with the risk of no spare capacity. Like living next to a volcano after a while you stop thinking about it same situation here. Nigeria could explode any minute this is not priced into the market it has just learned to live with it..
4. SPR is being used as the swing producer untill the 05 storms this was not the case.
5. The Saudis oil production begin falling while oil was around $76. Production cuts I dont think so.
6. This market is dodging bullets. It required a string of positive events to allow it to fall to this level.
Using the current "low" oil price as a sign that all is well is misleading. It would only have taken one "normal" event to have sent it running a lot higher...
All is not well in the oil market one only has to check the falling tanker rates...
Know of a good website to track up to date tanker rates?
This site shows daily changes in the tanker index, but doesn't provide dollar rate or historic data. I just tried a quick search and couldn't find one that did.
http://www.lloydslist.com/
The comment that tanker rates are set to plunge seems accurate (see below), but doesn't provide any insight into oil depletion. We already know that exports haven't increased, so one would expect tanker rates to drop, regardless of whether the cause was limited supply or reduced demand.
Tanker Rates May Drop for Third Year, Hurting Frontline, OSG
2007-01-05 05:16 (New York)
By Alaric Nightingale
Jan. 5 (Bloomberg) -- The cost of transporting oil on
supertankers may fall for a third consecutive year as crude
shipments ease and new vessels are launched, prompting owners to
sell ships as scrap metal or adapt them for other uses.
Companies including Frontline Ltd. and Overseas Shipholding
Group Inc. may earn about $43,000 a day for hauling 2-million-
barrel cargoes on the benchmark 40-day round trip between the
Middle East and Japan during 2007, according to the median
estimate of 10 analysts surveyed by Bloomberg. Earnings averaged
$59,250 a day last year.
``We are looking at a year of high vessel deliveries and
softer trading conditions than typically prevailed over the past
three years,'' said Mark Jenkins, a senior analyst in London for
Simpson, Spence & Young Ltd., the world's largest closely held
shipbroker. ``That's likely to result in some owners of older
ships finally accepting that it's time to cash in their chips.''
Earnings for Hamilton, Bermuda-based Frontline, whose fleet
has the world's biggest carrying capacity, and Overseas
Shipholding are being squeezed by an expansion in the global
tanker fleet and a drop in Middle East exports. Since November,
OPEC has pledged to cut crude supplies by 1.7 million barrels a
day. Next year, 35 supertankers enter service, more than double
this year's additions.
$40,000 a Day
Owners probably will earn $40,000 a day from their
supertankers in the first quarter on the Middle East-Asia
voyage, according to the median estimate of nine of the
analysts. That compares with $71,910 last year, according to
London-based shipbroker Galbraith's Ltd.
The very large crude carriers, or VLCCs, that will either
head for conversion yards or be broken up for scrap are likely
to be those with one layer of steel separating their cargo tanks
from the ocean. Single-hull vessels, due to be banned by the
United Nations from 2010, usually earn less and are a higher
risk to the environment than those with two hulls.
Frontline's profit fell 19 percent to $381 million in the
nine months to September as a glut of vessels reduced hire
rates. Earnings at New York-based Overseas Shipholding, the
biggest U.S.-based tanker owner, dropped almost 21 percent to
$279.4 million. Frontline said fourth-quarter performance would
be even ``weaker'' as reduced OPEC shipments cut vessel demand.
Hire rates for VLCCs dipped below Frontline's stated break-
even levels at one stage in the fourth quarter. Profit from the
company's single-hull tankers probably was hit even harder,
earning about $10,000 a day less than double hulls, Chief
Executive Officer Bjorn Sjaastad said in November.
Just as earnings for the vessels declines, a rally in crude
prices is presenting owners with other, more profitable ways of
employing them.
Baltic Dry is the standard. Perhaps u can get a friendly tanker link from one of the sites that cover it.
http://www.slate.com/id/2090303/
http://investmenttools.com/futures/bdi_baltic_dry_index.htm
In the meantime, here's a historic view compliments of iea:

http://trendlines.ca/energy.htm#misc
Last week i asked Jeffrey at what rate KSA production would have to return to or exceed for him to admit that his sentiment on KSA Peak was in error. He was silent. I will give u and/or others the same opportunity.
Rather than challenge almost every one of your points, i will approach it in this fashion: Last autumn, i was almost alone in forecasting that the usa avg contract price would return to the low 50's by year end from its Sept high of $69/barrel. From early reporting it appears that oil closed out at approx $54. At what contract price (not spot) would u agree that your hunch and position is in error ... and we'll wait and see?
I would say one thing that would be very important when analyzing future SA rates is that only looking at C+C needs to stop. They have major GTL projects, as well as huge additional refinery capacity coming online in coming years (ie they will be exporting less crude and more refined products).
The refinery capacity that they are adding makes it sound like they are much more optimistic about their future production than many around here.
They may need all their NG just to run the gas turbines that are pumping more water. Also their growing pop. requires more desalinization plants. In 05 KSA produced only 1/7th of the NG that the US produced.
It would make sense to add refinery capacity if you are importing refined products, because of internal increased consumption.
Yes increasing KSA's refining capacity could mean that they are optimistic on production but/and it could also mean they acknowledge that there is a worldwide shortage of light sweet oil and KSA's "Arab Light" is an intermediate grade with high sulphur content -- for which there is currently and for the at least next 4 years there will be a shortage of refining capacity in the US and Asia.
"At what contract price (not spot) would u agree that your hunch and position is in error ... and we'll wait and see?"
That depends on the psychology of the market participants.
"Last autumn, i was almost alone in forecasting'
Lets all give fast freddy a round of applause and a pat on the back of the head he so desperately needz.
Freddy
First, this site is mostly interested in po, not peak prices. Regarding the latter, you predicted low prices because your lot predicted record production. In the event, production plateaud but we had another warm winter, and it is weather related demand destruction, not price, that is the real reason prices have not gone back up even tho storage is down to last year's. THere is absolutely no indication that the major consuming nations are cutting back on account of price. Regarding po, your consensus projections' predictions for 06 were for significantly higher produciton than 05, and there was no recession even as avg price hit a nominal record for any year... so, your continued hopes for higher production in future years should have a logical explanation for last year's miss, otherwise you should join peak now.
Second, I posted the following reply to a comment you made a week ago... the new format lets me see my comments, but not whether they generated responses, so maybe you can't see it:
As I told wt, no month will be remembered as a peak, just as no q will be. What is important is the peak year; the interesting points are a) that a great 3q was not able to bring 06 above 05, and b) that 4q dropped back quickly, indicating that 3q production level is not likely to continue.
Your comparing the 1999/02 plateau with the current one is like apples and oranges... then, the US, japan, and parts of europe were in recession, and prices were low. The current plateau is happening with good gdp growth and record prices. Everybody, not least sa, is producing balls out. Not one barrel was left behind last year on account of low prices or demand destruction, excluding only the modest cutback by opec nov/dec. In spite of this, all of your contributors, including colin, over predicted 06 production, and by a lot... what, indeed, was their consensus for 06 production? This is a serious question, and one which you could answer if you are willing to... but, I don't really expect an answer as it would undermine your position.
Meanwhile, stuart and his plateau was right on, and wt was not far behind. Something seems to have gone awry with your consensus, given that nominal 06 prices were at a record high. What might have happened?
THe peak oil now (pon) crowd thinks major producers are declining at a much higher rate than your lot expected. north sea, sa, mexico, us gulf, china? (certainly daqing, but anyway a bit murky there), etc. us historical decline data does not work for the rest of the world because of the high tech, eg horizontal, is allowing fields to be produced at a higher rate at the end of their life, naturally leading to very rapid decline rates. Old on shore fields are being produced exactly as off shore fields are, and will therefore have similar decline rates. This certainly appllies to nearly all sa fields, not least ghawar, and probably iran/q8 as well (the latter may anyway have to reduce production on account of parliament wishing to limit produciton to 2% of actual, as opposed to imanginary, reserves.)
A reason mentioned by a few is equipment. Your fav IEA says there will be no problem "as long as the necessary investments are made." IEA probably meant financial. But, what if what is necessary exceeds the world's available rigs? SA is increasing rigs as fast as they can, which is already slashing us gom ng production. And, while sa produciton is no doubt higher now that they have 60 rigs than what it would be if they has stayed with 18, production is nevertheless declining fairly rapidly.
Colin, thrice bit mostly on account of deep offshore in s. atlantic basin, is naturally a little shy. IMO he is looking for ngl production to come on line faster than is likely.
How long wiil we manage to cling to the plateau? How long will new fields (none in sa) manage to make up for accelerating decline and equipment delays? We'll just have to wait and see. Your conviction that production will soon revert to an upward climb should explain why 06/05 was flat. You have been turning Economics 101 on its head; economists normally claim that high prices lead to higher supply in a free market, not that high prices lead to lower or stagnant supply.
BTW, how interesting that it is all happening at once. US ng peaks in 01, canadian ng in 02, world oil in 05/6, the us now inporting coal as GB and western europe desperately looks to import oil and gas... We live in interesting times. Lets hope for more warm winters, which is the real demand destruction these days, not price. Consider that high ng last year boosted fuel oil demand, missing this year...
The price of oil is not really low they are volatile I'd urge someone with the numbers to track the price of oil over the last few years and I think you will see that it has been varying over a far wider range than normal. This is in fact the signature of peak oil. Highly volatile prices with random spike as events converge to cause a "run on the bank".
Expect more of it over the next few years.
In fact if I'm right about the situation expect a peak about Feb 15-March 15 or so to the 70-80 dollar range.
I've debated making the prediction but now I'm about 80% confident it will happen. We will see.
usa centric oil volatility with Price in black on LS axis & % in red on RS axis:

Trying to steal content and/or infringe copyright ?
Forgot to read this I suspect
The chart on the linked page is probably what he meant to link, it fits Freddy's description at least.
Hmm the chart seem to be off by a bit we should be back down quite a bit form the last peak.
But notice how bumpy the price peaks are not by any means smooth.
About what I thought it should be. We should start another spike soon as I said.
The main point is that if oil is really plentiful we will simply continue to drop of this peak if not it will spike again.
Using a calculator, any of us can see that KSA would have to drop to 8.4-mbd and globally we'd have to dip to 77-mbd from 86-mbd to get back to the old regime lines. And that ain't gonna happen.
No? After the latest announcement the Saudi are just 100.000 b/d away from reaching 8.4.
Like the emperor you have been shown to be naked. Only you're more like the court jester.
I am continually surpised that so many people on TOD refuse to believe that some or all of Saudi production cuts since last summer could be the result of a deliberate policy of production restraint arising from the drop in the price of oil.
To suggest that Saudi production has droppped from 9.60 mm bpd to 8.50 mm bpd in a little over six months purely as a result of involuntary production decline is naive in the extreme. This would suggest an annualised decline rate of somewhere in the region of 20% which is clearly ridiculous.
To my mind the credibility of numerous contributors on this board will be put in serious jeopaardy unless they are willing to admit that Saudi Arabia is capable (and willing) to enact VOLUNTARY production cuts to stabilise OECD petoleum stock levels and thereby defend certain price levels for crude oil.
The risk of continued denial of this possibility is that many hitherto credible and valuable contributors to this site collecively become seen as the "boy who cried wolf". In the longer term, the importance and ramifications of peak oil (or peak hydrocarbons) are too important for any knowledgeable contributor to lose credibility over such a transparent case of market management as Saudi Arabia is currently engaged in.
Please, can we get back to debating issues of clearly greater substance. It is absolutely 100% given that Saudi has voluntarily cut production quotas in accordance with OPEC policy and this will be clearly demonstrated as soon as oil prices rise again to the mid-$60's. This will occur when OECD petroleum stock levels decline to a more historic average than at present. This in turn will occur when sustained colder winter weather arrives or OPEC production cuts finally take necessary effect in the market. In any case I expect prices to begin to recover going into the second quarter as the market bids for barrels to increase stockpiles ahead of the US hurricane season.....
why do you consider a 20% annual decline rediculous ? as westex, etal have discussed when the water rises to the level of the horizontal wells, what else would you expect ? i am not saying it is or is not 20% but 20% is NOT rediculous
Ultimately 20% would not be a ridiculous decline rate for one field (as we may be seeing at Cantarell for example), but it seems excessive relative to an entire producing region across multiple fields at differnet stages of production/decline.
I am not aware of any producing basin (as opposed to an individual field) that has declined at such a rate and certainly not within such a short time of having hit its highest production levels (ignoring the eaarly 1980's peak which we know was subsequently impacted by macroeconomic rather than geologic issues).
More importantly, decline in older producing regions (such as Saudi) seems to start relatively slowly and then accelerate. I think this is because secondary and tertiary recovery are deployed sequentially. In newer production basins like the North Sea (and particularly with newer fields in the North Sea) decline sets in rapidly almost from the outset of production. This seems to be because primary, secondary and tertiary production techniques are deployed from the start to maximise net present (monetary) value of the field's reserves.
I am by no means an expert in this field. What I have writtten above is largely a result of what I have learnt here and on other sites and I have no wish to start a war of words. However I stand by my assertion that many people with more knowledge and input than myself are putting their reputations at risk here. These people need to have their credibility intact far more than I do when the peak oil issue is debated in a wider environment than TOD.
According to the EIA, the last time that the Saudis (KSA) made 9.6 mpbd (C+C) was 9/05. Again according to the EIA, KSA has never exceeded 9.6 since then--and IMO it never will. Assuming that the 2/07 production estimate of 8.5 mbpd is correct, we have seen a decline of 11.4% in 15 months, or an annual decline rate of about 9%. Note that to get more accurate numbers over a longer time period, we need to use logarithmic calculations.
I have frequently pointed out that Ghawar and Cantarell are similar fields--the two largest producing fields in the world, carbonate reservoirs, where the remaining oil is in rapidly thinning oil columns between expanding gas caps and rising water legs.
We have quite a bit more data on Cantarell. According to the WSJ, as of early 2006, the remaining oil column at Cantarell of 800' was thinning at the rate of about 300' per year. The worst case decline rate, i.e., the most realistic IMO, was for an annual decline rate of 40% per year. Energy analyst David Shields has discussed how Pemex sought to hide their internal estimate of the Cantarell decline rate, using a more optimistic decline rate in public. (I wonder if Saudi Aramco might be doing the same?)
Ghawar has probably produced close to 60 Gb. Matt Simmons quoted a retired Aramco executive (the old Aramco) as saying that Ghawar would never, in his opinion, exceed 70 Gb. If that is correct, the field is about 85% depleted. We do know that the oil column was thinning rapidly, because the vertical wells were watering out, which is why they were forced to go to horizontal wells. Even after going to horizontal wells, the best case is that they still producing about one barrel of water for every two barrels of oil--not a stable situation. Until recently at least, Ghawar accounted for more than half of KSA's production. What do you think will happen to Saudi production when the water hits the horizontal wells?
I have repeatedly described Ghawar and Cantarell as two warning beacons, burning brightly in the night sky--heralding the onset of Peak Oil. IMO, these two fields, which at least at one time accounted for 10% of world C+C production, are both in terminal decline.
WT,
You are one of the people who I am most worried about in terms of blowing your credibility by putting all your eggs in the "Saudi has peaked" basket. It will not matter in the future if you have been right on 99 out of 100 other issues, you will be remmebered (and attacked by the Cornucopian factions) for the one you got wrong.
In my opinion, none of us can say with absolute certainty what is the situation at Ghawar and other KSA fields. Neither can we rely on "retired Aramco executives" who have spoken to Matt Simmons. Without documentary evidence this all "hearsay" and opinion.
It is my opinion KSA is currently voluntarily holding back production from the market to try to draw down OECD petroleum inventories and increase (or at least support) crude oil prices. There are numerous previous examples of this behaviour by KSA and OPEC in general.
My reference to "20% decline" was made in reference to an annnualised extrapolation from last summer's peak production rate of 9.50 mm bpd. It does indeed look very different if you calculate it from Sept 2005 when 9.60 mm bpd was achieved. One could also argue that the decline would lok very small on an annualised basis if taken from all time peak production in 1980 (??). My point remains however that it SEEMS unlikely to me that KSA as a whole would suffer a 20% annualised decline from recent peak rates (ie summer 2006) even if Ghawar is in permanent decline.
From my reading about Ghawar, I am left with the impression that it would better be described as a series of smaller oil (still huge) oil fields rather than one entity. The recent Haradh development (300 kbpd) seems in fact to be part of the southern part of Ghwar but is talked about as a separate field. In this respect I think it is likely that parts of Ghawar are in more serious decline than others, and indeed that some parts can still undergo further development.
Do you think that "when the water hits the horizontal wells" this is likely to affect all the whole of Ghawar at the same time? Would this not suggest a far more uniform field than Simmons et al lead us to beleive is the case? Clearly when each individual well encounters water, that is pretty much it for that well, but how many wells are there across the whole of the Ghawar complex?
In the past, Saudi Arabia has tended to curtail production when prices fell, and to increase production when prices rose, i.e., Saudi was the successor to Texas as the primary "swing" producer, which is why I use Texas as a model for Saudi Arabia.
This time, Saudi Arabia announced their "voluntary" production cutbacks, just as oil prices were headed to all time record (nominal) highs. This also corresponded to the start of the 2006 Saudi stock market crash, in contrast to the Venezuelan stock market, which is booming.
My opinion is based on mathematical (HL) models. Saudi Arabia started declining--as I predicted--at the same stage of depletion at which Texas started its permanent decline. Based on the HL model, Saudi Arabia is 60% depleted. I am not aware of a single case history of a producing region (60 Gb or more) showing sustained production increases past the 60% of Qt mark. In effect, you are arguing in favor of something that the world, insofar as I know, has never seen.
I understand your reasoning and I know I am incapable of refuting the HL mathematical model. I am not convinced the model will prove accurate for KSA, because their production decisions are I believe more complex than those of the Texas Railroad Commission. Furthermore technology has changed dramatically since Texas peaked allowing for greater recovery of oil.
This has had the effect of prolonging the "tail" of production in Texas whilst doing nothing to change the date or size of peak. But hasn't it also significantly increased the URR of Texas? If that is rigth, does it not also that peak production occurred before 50% Qt, and increasingly so every year?
If such technology has existed several decades beforehand, would it be fair to say that Texas may have peaked sooner and at a higher rate than it did, or alternatively that it would have been able to sustain a higher rate of production than it actually managed in the early 1970's as the technology was not then developed?
"Secondary" and "tertiary" production techniques now appear to be applied at the inception of a fields's production. This means that peak flow rates will occur right at the beginning of a field's life. I am just a beginner when it comes to HL, but surely this fact would refute the methodoliogy if applied to recent individual fields in the North Sea, or indeed to the North Sea as a territory if we only counted fields developed since, say, 1990. Clearly, if peak production occurs at the beginning of a field's life, it will be quicker to reach 50% Qt, but production rate per se will be an irrelevance in predicting URR? Or am I completely out of my depth here?
In the same way I think that developing (or developed) technology enables greater recovery of OOIP and increased URR. Inevitably this causes the HL curve to flatten. Peak production rates may not increase, but post-peak production will continue for longer on a shallower decline curve. This means that it should be more likely that we see increasing cases of " sustained production increases past the 60% of Qt mark" since the URR will still be increasing at that time. Doesn;t this make the HL method less predictive than it migh first appear? Obviously, in retrospect, these production increases will not have been "past the 60% Qt mark" because, unbeknownst to us at the time, URR was increasing and thus %Qt was therefore less than 60% during the period of observation... I am confusing myself here....
I am not trying to be argumentative here, but thse questions have been bugging me for some time and appear very relevant to the general subject matter at TOD.
Two points.
First, the North Sea peaked 29 years later than the Lower 48 (1999 versus 1970), but the North Sea, like the Lower 48, peaked right at the 50% of Qt mark (C+C). So much for better technology.
Second, we have had access to much improved technology here in the Lower 48 and Texas, and depletion marches on.
I am not arguing that technologyn has not been available in Texas/Lower 48. I am questioning what would have happened to peak production and date if the sort of technology we have today (horiozontal well, bottlebrush wells, etc) had been available in, for example, the 1960's.
Similarly, if the UK North Sea had ALL been developed as new fields are (ie going to peak production within the first year, and then into a long term decline thereafter), would this not have dramatically altered the shape of the curve, and therefore the results extrapolated from that curve?
Both of these are clearly totally hypothetical questions, but they seem relevant in that the theoretical answers suggest that Hubbert might have had to revise his theory had present day technology been available in the 1950's.
This certainly does not mean that the whole HL methodology is wrong, but as URR increases year by year as marginal improvements are made in recovery processes, or as oil prices allow production from previously non-viable fields, this must have an impact on the results of the methodology itself, if only to broaden the Qt range at whick peak will be crossed for example.
I would love to see an HL plot for all (UK and Norwegian) North Sea fields developed since 1990 - I am convinced it would lead us to hugely different conclusions than Hubbert's original work. Though maybe an extreme case, it would make an argument for consideration of technology improvements since Hubbert originally produced his theory.
You don't apply HL to individual fields. In its most useful form it is a heuristic of the production profile of a range of fields that statistically vary in rate parameters.
There ya go from this article.
Not to be a prick, but it did take me about 30 seconds to find that with google. Perhaps before you become "convinced" you should at least look at the data.
More accurately, I think he meant to ask for a recovery ratio of fields that were exploited only from 1990 to the present, not a HL for the entire region.
You could be right. Looks like I read that a little too quickly.
That data would take a bit more than 30 seconds at google to find.
Thats a pair of very ignorant comments, even when compared to some of your less well thought out spin cycles, WT.
The purpose of technological applications on an oil field is are two fold: 1. To allow us to exploit resources that we could not exploit before 'IE deep water' 2. To increase the total volume of oil that could be extracted from a field that we could exploit before.
Point 1 is perfectly obvious. Without technological advances, we could not have exploited the North Sea or many GoM fields. By doing so, we increased total URR for the entire world.
Point 2 SHOULD be perfectly obvious to you, but apparently it is not. By increasing the total volume of oil we could extract from a field, we generally also increase the maximum production rate. The two work in tandem, and when you increase the maximum production rate, the HL for the region is realigned to reflect a larger URR, not only for the field, but for the entire region. As you said, production usually peaks at around 50% qt, give or take 5% or so. It appears you failed to take into account that without new technological practices implemented on the field, we would not have been able to exploit as much of the initial resources in place, but would have still maintained a HL that peaked at 50% of qt, just with a much smaller URR
But I'm sure yours, and everyone else's initial responses are quite obvious: "if technology is increasing the recovery ratio in the industry as a whole, why do most older fields in which new technology is applied fail to have a significant upswing in production and overall growth in URR?"
The reasons for this are also quite simple. As you so eloquently mention on multiple occasions, one of the primary recovery methods involve pumping in water into the oil field to increase pressure and maintain the flow of the field for as long as possible. While an oil field is exploited, it also develops a gas cap on top, essentially squeezing the total production volume into a lower and lower area. Once an area is flooded with water, its very hard to get any more oil out of the source rock, likewise once an area fills with gas, its very hard to maintain enough pressure to liberate and pump the left behind oil out. The end result is always declining production and a smaller recovery ratio, usually far sooner then we would like.
But to try to be short and simple on the answer: new technological applications that are done AFTER destructive primary recovery methods generally fail to produce a significant upswing in production and ultimate recovery rates. At best, you are left with a logarithmic production curve on the tail end of the fields life cycle.
However: new technological applications that are done before OR in tandem with primary recovery methods generally help you to exploit a far larger portion of the IOIP. For example, pumping in CO2 to 'loosen up' if you will the oil in place AND pumping in water can lead to significant increases in the recovery ratio for a field. Likewise, so can horizontal wells and well placement based on precise 4d seismic data.
Trying to apply the new techniques to a field that has already been completely flooded with gas and water, and consequently has a 90%+ water cut, generally meet poor results. But with fields like Gwahar, applying these techniques when the water cut was around 33% has led to generally positive results and an overall increase to URR combined with a gentler downslope.
In closing, I would like to point out something that many seem to have forgotten: as Colin Campbell has stated so many times, most of the fields in play today were explored and initially exploited 40 or more years ago, LONG before the new technologies many people are bringing up came into play. Older fields, as I mentioned, will show only a slight increase in URR, while newer fields and those fields that had not yet been significantly exploited WILL show an increased recovery ratio.
Over time, this will gradually increase the global average recovery ratio, perfectly in line with what we have seen since the early 1990s. Finally, due to the high volatility in oil prices since the 1970s, very little new production from the 'expensive to exploit' field category has come on line for obvious reasons. These new fields will show significant differences when compared to their older and larger Kings and Queens.
Questions or comments?
Shikata ga nai
you are correct re a 20% decline for multiple fields ... it is excessive. even the 9% or so estimate by wt would be a lot for multiple fields unless they were all "hiting the wall" and i realized that after i posted. but, otoh if the water was at the level of the horizontal wells for the one biggie, ghawar, a 20% or even 40% annual decline for that one field would not be out of the question.
For starters, the decline is not in six months. Saudi last produced 9.6 mb/d in September of 2005. If they produce 8.5 mb/d in February of 07 then that is a decline of 11 percent in 17 months or less than 8 percent per year.
And yes Saudi is declining by 8 percent per year.
If you would just do a little investigating before you post, then your posts would not be so damn ridiculous.
Ron Patterson
Thanks Ron.
You are right, I ought to have considered that 100 kbpd difference between Sept 05 and June 06, production numbers being as precise as they are....... especially from Saudi Arabia.
I am sorry you find my posts ridiculous and I apologise for asking questions which appear to me (an ill-informed, ridiculous fool) to have some relevance to the debate about Peak Oil.
I further apologise to all TOD users for taking up valuable thread space solely for the benefit of trying to further my own education and understanding of peak oil, and obviously for articulating wild (indeed heretical) questions about the impact of modern day production technology on a thesis first mooted in the 1950's before such technology existed.
In future, I will be sure not to question anything about peak oil ever again. Would it be preferable to you if I simply never posted again?
Let's talk again next time oil prices have rallied due to weather or other (non-Saudi-related) reasons and see how decline rates look then....
You are being sarcastic, and looking even more like ridculous in the process. Saudi production in June 2006 was 9,100 kb/d. The differenc in that nine months time is therefore 600 kb/d, not 100 kb/d. That works out to be an annualized decline rate of 8.8 percent.
Again bunyonhead, all you must do is examin the data and you will not make such silly mistakes in the future. The data on Saudi Arabia can be found here:
http://www.eia.doe.gov/emeu/ipsr/t11a.xls
And let me remind you bunyonhead you were the first one to use the word ridiculous. Had you not done so then neither would have I. Please don't attempt to dish it out if you cannot take it.
Ron Patterson
Bunyonhead
Sometimes you make mistakes. Sometimes I make mistakes. I admit it to myself and move on, and if someone else notices and calls me on it, I admit it to them and move on. Nobody is perfect.
As the saying goes, you would be a lot less worried about how much people thought about you if you knew how seldom people thought about you.
Funny how they produced 9.3 mpd in July and August of 2006, then declined in line with what they said they were going to do based on demand and the stated OPEC cuts.
Like an above poster stated, the objectivity on this board is severily lacking.
So Saudi Arabia is punishing the US for fighting the Sunnis in Iraq? How else would you explain their complete reversal in policy in the last few years?
I agree that we should not look at sa produciton post oct06 as proof of anything, and have said so to wt. What is causing concern is that sa rig count is up 3x since nov04, meaning they're trying at great cost, and meanwhile their production declined all year, including the summer period of highest prices. Their late spring statement that they could not find buyers for their oil, even as russia passed them in production and as some newer producers expanded exports, is not credible to me.
hmm... this "dog leg up" looks a little bit tired to me:
A little zoom:
As Rembrandt said you don't have enough points to draw any conclusions yet.
By your small CumProd, it appears that u are using the narrow definition of supply (C+C) ... not the all liquids definition that KSA uses in its statements and on which my projections were made. I note however that your URR is increased from Jeffrey's link.
Re: ... not the all liquids definition
The "All Liquids" is simply Crude Oil + NGL for SA (the Other Liquids category for SA is very small).
If 2 million bpd of NGL is 'very small' then that helps explain some posters mentality :P
I said "Other Liquids" (not NGL) is very small. Saudi Arabia does not produce biofuels for obvious reasons. For 2004, the "Other Liquids" production was 80 kbpd (compare to 421 kbp for the US or 4.7% of their production) or 0.76% of their total production. Refinery gains were 1.8 kbpd in 2004 (compared to 1 mbpd for the US).
Ethanol is illegal in Saudi Arabia. They could produce biodiesel from waste grease, I suppose...It's not the money. They spend huge amounts subsidizing circle irrigation wheat farms that use up their precious aquifer water at about six times world cost.
Khebab & Jeffrey's preoccupation with C+C preserves their non-reputations. Nobody cares. Thru Y2k, 2001, 2002 & 2003 we watched in pain as Colin Campbell tried to cling to the hope that a 1956 theory was correct and that with Hubbert dead, he would be the holder of the torch. In each monthly newsletter, Campbell repeated his Depletion Model graph showing a Y2K Peak of 64-mbd for Conventional crude. Finally in Feb 2004 he admitted that the theory was DEAD.
But it would have been a hollow victory none-the-less. At the time, All Liquids supply was at 83-mbd. Nobody cared about Hubbert. MKH's theory was fine. But his figures were a disaster. Setting aside the fact that his URR for global Conv oil was 1250-Gb (half of reality), his Peak Rate was only 34-mbd. Worse, the Peaksters like to cling to this Y2k Peak when everyone else in the world knows that upon working more on his URR and past consumption errors, Hubbert changed his adopted URR (for Conv) to 2100 in 1971 and a target Peak Rate of 101-mbd. Yes. 101-mbd. And it gets worse. Or better! In 1974, still working on past consumption errors, Hubbert changed his Peak Date to 1995, he decreased his Conv Oil URR to 2000Gb; and increased his target Peak Rate to 110-mbd. 110-mbd. You can see his graphs and text in 1976 National Geographic (or my website).
So this crap about Hubbert's brilliance is plainly data fitting by the Peaksters. Better for Hubbert to be out five years than ten, eh.
Getting back to the thread and topic at hand, narrow focus is the playground of academia. Nothing else. As far back as 1949, Hubbert was addressing Total Liquids URR. His 1949 Estimate was 1125-Gb for Conv only and 1948-Gb including Alberta tar sands and global oil shales. We can thus assume that his 1974 URR was in fact 2823-Gb incl "all liquids". Had Hubbert spent the little extra time on a curve for all liquids, he would be famous. Now his three targets just look like dart board jobs.
With respect, his theory and position of Peak Oil was correct. He was an advocate of raising its awareness 'cuz he was a proponent of hydro and nuclear power generation for the future. It is sad that not enuf listened.
MEES shows SA production of 9070 in Oct, then 8780 in November. I imagine the drop in the dog leg would be further emphasized with this data point.
According to the EIA, the production in October was already 8.800 mbpd (C+C):
http://www.eia.doe.gov/emeu/steo/pub/3atab.html
So in essence, we are not only picking what category to include in Saudi Production, but what data source to use as well. Whatever fits your conclusions best I suppose...
There are not much differences between agencies anyway. The EIA makes regular updates on its monthly estimates in order to match the IEA numbers.
I have no conclusions. SA is a black box. Not enough hard facts and too much circumstantial evidence in my opinion. However, some are drawing conclusions on Saudi Arabia's URR from a "dog leg up" composed of three points! All I'm saying is that recent production numbers seems to revert toward the logistic line.
4 points...
Great... :)
How many points does it take to make a trend line then? Or are we going to continue to use an arbitrary standard that changes to suit whomevers purpose and point of view at the time, so long as it cast the issue in a pessimistic light.
We're watching paint dry here, buddy. And since paint can dry awful slowly, we have ample time for discussion and to gather further supporting evidence for any assertions we may have.
Khebab, being a scientist/engineer, probably knows a bit about Kalman filtering, whereby one can use a model of the data and potentially change that model in real-time to best analyze a stream of data. It all fits into a Bayesian world-view. Rest assured that Khebab does not force the data any which way he wants to. The data is taking us on a myriad path, a path slow enough to drop a whole arsenal of mathematical tools on the data-set.
I cannot agree with that statement at all. The EIA revisions always apply to individual nations and often go back many months for that nation. That appears to be because of some revision in reporting procedures by that nation. At any rate, I have seen the EIA revisions go directly opposite the IEA numbers. In other words, I have seen the IEA show an increase and then the EIA numbers would be revised to show a decrease.
Ron Patterson
A few instances:
http://www.eia.doe.gov/ipm/whatsnew.html
Note that the IEA is only credited for revisions to - demand - data (of dubious usefulness anyway).
Texas and the Lower 48 showed the same "Dog Legs Up" right before they peaked: http://www.energybulletin.net/16459.html
Note that the HL plots that Khebab did for KSA and the world used these "Dog Legs" in the best fit line that he did for the two regions.
Texas is especially interesting. If one were to only use the data right before the peak, it would point toward basically infinite reserves. From 1962 to 1972, Texas production increased from 2.5 mbpd to 3.5 mbpd. From 1972 to 1982, Texas production went from 3.5 to 2.5 mbpd, despite the biggest drilling boom in state history--which caused a 14% increase in the number of producing wells.
From the 1/5/07 Discussion I had with Robert:
Re: "We can't use Texas as a model for KSA (because of the vast difference between the field size distributions)"
The Lower 48 and the North Sea have vastly different field size distributions, yet both regions, on C+C HL plots, peaked right at the 50% of Qt mark.
Re: "Texas has a very noisy HL plot, prior to the peak"
True, but we have more than enough data to get a solid Qt estimate, and the KSA HL plot is much more stable.
As noted above, KSA started declining, as I predicted, at the same point at which Texas started declining. But I'm sure that's just a coincidence, and the rapid thinning of the oil column in the Ghawar Field is nothing to worry about. And a (best case) one third water cut with horizontal wells (after the vertical wells watered out) is a sign of robust health in the world's largest oil field. Look how well it worked for Shell at the Yibal Field.
Edit: Note that Hubbert's prediction was of course for a Lower 48 peak between 1966 and 1971.
Russia produced just above 11 mbpd to just below 11 mbpd for five years before to five years after 1984. Russia hit the 50% of Qt mark in 1984. A coincidence?
I've looked at Khebab's plots of Russia. Russia's production goes flat in 1981, the same year as most other oil exporters (most of OPEC, Mexico, probably others too) production declined because of falling demand. Coincidence?
Then in the late 80's oil prices fell, I hear this led to a rough time in the Texas oil patch. This couldn't have had an adverse effect on Russian production?
Then the Soviet Union breaks up. The chaos couldn't have led to the decline in Russia's oil, could it?
No, in your view everone of these is caused by peak oil. I guess if the only tool you have is a hammmer everything looks like a nail.
The big oil price drop was in 1986, after Saudi Arabia flooded the market because they were tired of curtailing their production to keep the price up and/or in consort with the US (trying to hurt the Soviet Union). In reality, the absolute peak in Russian production in 1989 was largely an effort to increase production to make up for the lower price.
The very sharp decline in Russian production after 1989 corresponded to the collapse of the Soviet Union. In recent years, Russian production has rebounded.
Given these facts, I was curious as to what the production data through 1984 would predict for post-1984 cumulative Russian production. Khebab generated a predicted production profile, using only the production data through 1984. The post-1984 (post-50% of Qt), cumulative Russian production, through 2004, was 95% of what the HL model predicted it would be.
As I suspected, the recent rebound in Russian production basically just made up for what was not produced immediately after the Soviet collapse.
The same exercise for the Lower 48 demonstrated that the post-50% of Qt cumulative production, through 2004, was 99% of what the HL model predicted it would be.
If we apply these two models to the world, it suggests that Deffeyes' estimate of 1,000 Gb of remaining conventional C+C reserves (as of 1/1/06) is quite accurate.
If Deffeyes is correct, and the mathematical models say that he is, by the end of 2009--at the current rate of consumption--we will have burned through 10% of our remaining conventional C+C reserves. This is why world conventional C+C production is declining.
My 1/6/07 post on the four current super giant fields (that are, or were, producing one mbpd or more):
http://www.foreignpolicy.com/story/cms.php?story_id=3567&fpsrc=ealert061...
The List: Taking Oil Fields Off-line
My comments:
Freddie: If I had ever gone to a meeting and presented something like the new slope on the chart, they would have had a good laugh and then presented me with my last Supper. Look folks I just acquired some new data and it looks like we are headed in a shallower slope. I admit its only one more than a couple of data points but look what it does! What do you suppose the slope will be when the water hits those horizontal boreholes? What about 89 degrees off of Horizontal? Well at least not until they are all floundering.
The reason the slope has shifted is because in 02 there was a significant spare production capacity. The spare capacity is now gone after three years of significant demand increases. Production is now flat for 05 06 and 07, so you will see the slope of the world curve shift back to a slightly steeper slope than it had before 02. Increasing production causes a shallower slope. Decreasing production will cause a more vertical slope.
Freddy Hutter says: >>This bodes well for long term availability of oil globally, but is not an indicator that Peak Rate or Peak Date will be extended. It will likely only dampen the decline rate.<<
That conclusion may be correct.
However, HL is not a physical model and is it possible that rapid extraction techniques are causing the dog-leg up. In that event predicted URR from HL using recent production points may overstate URR. As a corollary there may also be sharper post-peak declines than has been historically observed.
Correct.
Also a lot of the small fields that the world depends on are getting old now. And many of these were developed with advanced methods. In aggregate you may be surprised at how much they will effect decline rates.
Maybe Kehbab will do some plots of average field production life and the total production life for various size fields. We focus on the big ones but the little field numbers are probably not that good.
Happy New Year!
Consider this a reminder to positively rate this articles (using the icons under the tags in the story title) at reddit, digg, and del.icio.us if you are so inclined. (email me at the eds box if you have questions about this)
Also, don't forget to submit this to your favorite link farms, such as metafilter, stumbleupon, slashdot, fark, boingboing, furl, or any of the others.
I can assure you that the authors appreciate your efforts to get them more readers.
Chart 1 (that's a 30-year growth multiplier and average of oil and gas**, BTW) has huge problems from a detailed analysis of how it applies censored statistics. I have written about it extensively here:
http://mobjectivist.blogspot.com/2007/01/censored-data.html
I think you have some of the intutitive features captured (i.e. new technology) but the missing link is how exactly censored data enters into the mix. The extrapolation from censored data creates a significant speculative overestimate in how much the reserve grows. This is readily apparent from the classic chart you showed of Attanasi & Root from the USGS in Part 2 of the series. The fact that A&R used data from a 14 year window during a high demand time interval so as to back-extrapolate to predict 90-year-old (!) regions seems jaw-droppingly naive.
I have been engaging in an admittedly baited discussion over this issue with a professional geologist who specializes in reserve growth over at the peakoil.com forum. If you want to view a "lively" discussion, see:
http://www.peakoil.com/fortopic25486-0-asc-255.html
The bottom-line is that IMO the USGS has engaged in a complete statistical fraud concerning the reserve growth estimates. Not doing censored data right is basically equivalent to someone just making data up from thin air. This is a travesty that the US government has been engaged in and I consider it scientific fraud.
** If it was just oil, then the initial growth multiplier value is more like 8 !
Here is the original A&R chart BTW.

Thanks Rembrandt for bring this series to our attention.
I'm trying to understand your point. If I understand correctly, you are saying that some fields (probably small ones) are "shut-in" or dormant or plugged during their lifetime so their growth is frozen for an unknown period of time. These fields, which are censored, would obviously biased any results. A few questions:
1. I don't have the original paper of A&R, how do you know they have included such fields?
2. Can you correct for censored data?
Attanasi, E.D., and Root, D.H., 1994, "The enigma of oil and gas field growth", American Association of Petroleum Geologists Bulletin, v. 78, no. 3, p. 321-332.
They either become shut-in or get a spurt of new technology such as what happened with heavy oil in California (the Kern River oil field as Rembrandt mentioned). It could also be quota restricted or lower throughput during some stretches. In general, any throughput lower than extrapolated would lead to speculative predictions, which would imply the reserve growth predictions would be low during those times. This makes sense, since reserve estimates proportionally track the production rates, as the US oil companies have historically used this mapping as the proverbial "carrot before the horse" to lure the investment community.
There are a bunch of analogies to this misuse of censored data. I just came up with a fairly good one that overlaps pretty nicely with a 15 year time frame, namely that of investment interest rate prior to the year 2000. For example, say you didn't know how much an original stock investment was from the early part of last century. But you had growth rates from the period from mid-1980's through the 1990's. This period showed huge growth rates in investments, usually above 20% per year. If you would have used A&R's technique of not considering censored data, you would have shown incredible investment growth from investments originally made in 1900 (much, much more than the actual growth and much greater than reserve growth of oil, AAMOF). If then you were an investment advisor and tried to pull this creative bookkeeping using the A&R technique on your clients, the SEC would put your sorry ass in jail in no time. This is the equivalent of the standard disclaimer of "past performance is no guarantee on future returns", yet it looks as if A&R got away with it!
The problem right now is that one cannot come up with an estimate for the actual historical growth numbers unless one goes digging through the data and tries to apply some Bayesian-like corrections for estimated reserves prior to 1977. One thing the USGS could at least do is come up with error bars on the growth curves. What they show is the optimistic view to say the least. Not showing the pessimistic growth rates is really bad, and probably speculatively fraudulent if the SEC decided to look ito it. Unfortunately, the USGS is not a corporation and is likely immune to prosecution. IMO, they are simply useful tools of the oil industry.
The bottom line is that I am supporting what Rembrandt is intuitively trying to express, but I am trying to put it into somewhat more formal mathematical/statistical terms. Lots of literature out there on censored data and the sub-field of "Survivability Analysis" which is used by actuarians and life-scientists. Medical professionals know all about doing censored data correctly, because for survival estimates on new drugs, getting these predictions right is a matter of life or death.
Thanks for this clarification WebHubbleTelescope!
It's very interesting WHT, my feeling is that there are a lot of statistical pitfalls behind reserve growth analysis.
One way to test your theory could be to look at well documented datasets such as the UK or Norway.
This seems reasonable factoring in that they are all still fairly young relative to the US. And many of the North Sea rigs are getting shut down when the they hit some predetermined limit as it becomes cost-prohibitive to keep them going. I really don't think they will show much reserve growth.
The other data is from West Siberia.
The reserve growth as a whole is flawed because it is done from a top-down analysis. Best would be field by field, but this is impossible. According to Matt Simmons: http://hubbert.mines.edu/news/Simmons_02-1.pdf
The world is badly in need of better field-by-field production data. Reliable field-by-field production
statistics are only available on a timely basis for the North Sea oilfields. Detailed monthly reports are
published for the oilfields in the United Kingdom, Norwegian, and Danish sectors of the North Sea.
Outside this region, quality information of any type on the giant oilfields of the world is sparse at best,
including even the United States. Field-by-field data does exist for Alaska and the Gulf of Mexico, but it
is hard to locate and rarely published. Outside the North Sea and the U.S., locating reliable data on daily
field-by-field production for the other non-OPEC producing fields is difficult, and obtaining this data for
OPEC oilfields is almost impossible.
Some other models have a permanent "dog-leg up" in the their cumulative URR curves. You would get this if the second derivative of the curve is always positive and the curve is thus always "concave up". It thus never hits an inflection point which happens with the Logistic model in the straight-line regime (i.e. the second derivative is zero since the slope is constant).
I recall plotting this for early versions of the Oil Shock Model, and seeing the upward concavity (it also generates the high values near the origin).
http://mobjectivist.blogspot.com/2005/09/oil-shock-model.html
What about reserve depreciation as prices drop?
Has anyone ever observed that reserve numbers have been reduced when prices came down? (For example, when crude oil was trading at < 20$?)
Cheers,
Davidyson
I love you all, but right now I just want to scream.
I keep having a vision of a group of engineers on the Titanic furiously debating when the ship is going to sink, after it hit the iceberg, while the forward compartments are quickly filling with water.
In a sense, that is what is happening to the four current super giants--they are all watering out. As I keep pointing this out, my point keeps being ignored, perhaps because there is no answer to the near certain simultaneous decline/crash of all four current super giants.
Yet amazingly enough despite the 4 giants 'crashing', production at least remains flat and looks to increase this year. The answer is there in front of you, but you keep choosing to ignore it.
BTW, WT, why don't you comment on my observation that because KSA kept their production at a roughly constant rate for the better part of 12 years, their HL plot is skewed on the lower side.
Your silence doesn't bode well for your argument, WT. I'll give you another chance this evening to convince us how keeping a production quota roughly the same for 12 years doesn't skew the HL to the lower end ~_~
Hothgor,
These "Yes we have peaked, No we haven't debates" are getting really tiresome.
You apparently believe that the following ten facts are just coincidences, with no connection to the physical impossibility of an infinite growth rate against a finite resource base.
I disagree. Shall we just leave it at that?
Freddy's punters, as you are aware, all show substantial higher produciton in 06 vs 05 - not one of this lot predicted a plateau -, and the higher predictions were mostly based on production from new fields in the s. atlantic basin and the stans + ngl's, most of which came on as expected. That Freddy's consensus turned out to be wrong is not explained... he mumbles something about how higher prices are leading to lower production. Where's an economist when you need one?
IMO, flat production is on account of higher than expected declines from mature fields, certainly including the giants and thereby explaining sa/mexico/north sea/north slope reduced production, but also including all fields produced with high tech eg horizontals, great for sucking out the last bits just before the rising water hits the gas caps.
SA is trying hard, rig count up 3x in 2 years. What is the difference between declines in the north sea and sa? Honesty.
We will fall off the plateau when new fields are no longer able to stem accelerating declines from old fields.
Apparently it is a historical fact that the chief designer of the "unsinkable" Titanic was aboard during its ill-fated voyage, and within half an hour of finding out the extent of the long slice in the Titanic's hull he had made accurate pencil calculations to show that the Titanic had at best only a few hours to float; he told this to the unbelieving (and probably inebriated) Captain, and the skipper promptly gave the "Abandon ship!" order.
One thing I have never understood is why more measures were not taken to mitigate the inflow of water: Because of the way the Titanic was built it could carry a huge amount of water and still stay afloat, so long as it did not pitch forward or aft very much. The Titanic had huge and powerful pumps, and with only a moderate decrease in water inflow from the after part of the gash in the hull, I believe the ship might have been saved. Indeed, if the incoming water had been pumped to keep the ship more level, that action alone would have kept the Titanic afloat for some hours--possibly long enough to make some significant temporary repairs to the hull.
To observe that the Titanic did in fact sink is not any evidence that it had to happen.
Similarly, doomers who scoff at mitigation Peak-Oil strategies are, IMO, blowing smoke.
I keep having a vision of a group of engineers on the Titanic furiously debating when the ship is going to sink, after it hit the iceberg, while the forward compartments are quickly filling with water.
Of course that would have been a legitimate debate. If the Titanic had taken days to sink, then perhaps they could have reached a safe harbor.
The problem was the fifth compartment. If the last and most important compartment had not been breached, Titanic could have stayed afloat, or at least stayed afloat much longer.
Similarly, the problem for Saudi Arabia and the world is the largest and most important of the four current super giants--Ghawar. Water production is quickly displacing the oil production in the other three, and we know that Saudi Aramco had to go to horizontal wells because the vertical wells were watering out at Ghawar.
So, the only question is how quickly--not if--the rising water at Ghawar eliminates the bulk of the oil production.
A field by field production analysis -- which is what WestTexas is looking at -- is a fundamentally different "bottom up" analysis verses a "top-down" -- region by region -- oil reserves & production analysis.
Not many analysts look at oil production field by field as the data is impossible to obtain for several regions: http://hubbert.mines.edu/news/Simmons_02-1.pdf
But if we had the data "bottom up" analysis would be superior to a "top down" analysis.
Let's all quit quibbling and give each other a hug ;-)
If Westexas is right, we'll soon be seeing Saudi Arabia naked and in living color. I'd guess that around the middle of '08 is when the robe comes off ;-)
And if he's wrong, I'm sure we'll have enough excuses on why to write a new book :P
Best case scenario is that Ghawar waters out this year, but others do not. That would mean:
(a) Penny would drop on markets about Peak Oil;
(b) Gradual decline thereafter, making adjustment less painful; and
(c) House of Saud falls within 12 months.
So I just watch the numbers & hope.
Only shaybah is 'new', all other good land producers are 50+ years old, off shore 40+. GHawar is critical, but most of these fields will crash together. SA had 18 rigs end 04, last year was planning to top out at 80, now want 130... We will see rig count increase for a long time, imo will get to 180 by end 08, but imo will not stem the decline. Nothing they can do will replace the king and his court...